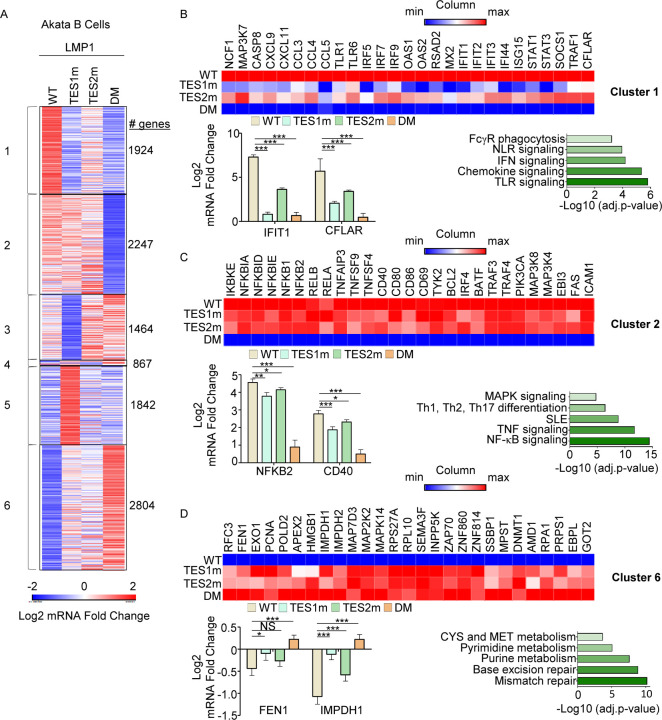
Fig. 5. Characterization of host genome-wide Akata B-cell LMP1 target genes.
(A) K-means heatmap analysis of RNAseq datasets from n=3 replicates generated in EBV-Akata Burkitt cells with conditional LMP1 WT, TES1m, TES2m or DM expression induced by 250 ng/ml doxycycline for 24 hours. The heatmap visualizes host gene Log2 Fold change across the four conditions, divided into six clusters. A two-way ANOVA P value cutoff of <0.01 and >2-fold gene expression were used. # of genes in each cluster is indicated at right.
(B) Heatmaps of representative Cluster 1 differentially regulated genes (top), with column maximum (max) colored red and minimum (min) colored blue, as shown by the scalebar. Also shown are expression values of two representative Cluster 1 genes (lower left) and Enrichr analysis of KEGG pathways significantly enriched in Cluster 1 gene sets (lower right). p-values were determined by one-sided Fisher’s exact test. ***p<0.001.
(C) Heatmaps of representative Cluster 2 differentially regulated genes (top), as in (B). Also shown are expression values of two representative Cluster 2 genes (lower left) and Enrichr analysis of KEGG pathways significantly enriched in Cluster 2 gene sets (lower right). p-values were determined by one-sided Fisher’s exact test. *p<0.05, **p<0.01, ***p<0.001.
(D) Heatmaps of representative Cluster 6 differentially regulated genes (top), as in (B). Also shown are expression values of two representative Cluster 6 genes (lower left) and Enrichr analysis of KEGG pathways significantly enriched in Cluster 6 gene sets (lower right). p-values were determined by one-sided Fisher’s exact test. *p<0.05, ***p<0.001.

