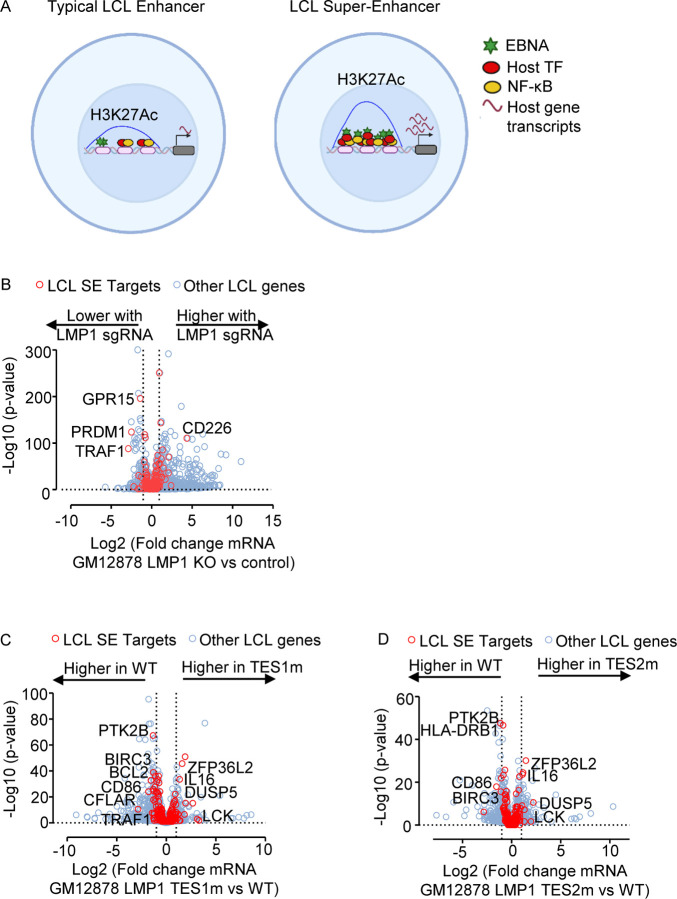
Fig. 9. LMP1 TES1 and TES2 roles in EBV super-enhancer target gene regulation in GM12878 LCLs.
(A) Schematic diagram of typical LCL enhancers vs super-enhancers. Super-enhancers have significantly broader and taller histone 3 lysine 27 acetyl (H3K27Ac) peaks. EBV SE are host genomic enhancer sites bound by all five LMP1-activated NF-κB transcription factor subunits, EBNA-2, LP, 3A, and 3C.
(B) Volcano plot analysis of mRNA values in GM12878 expressing LMP1 vs control sgRNAs as in Fig. 3. Genes targeted by EBV super-enhancers (SE) are highlighted by red circles, whereas other LCL genes are indicated by blue circles. Genes more highly expressed with LMP1 KO have higher x-axis values, whereas those downmodulated by LMP1 KO have lower values. P value <0.05 and >2-fold gene expression cutoffs were used.
(C) Volcano plot analysis of mRNA values in GM12878 expressing LMP1 sgRNA with TES1m versus WT LMP1 cDNA rescue, as in Fig. 2–3. Genes targeted by EBV super-enhancers (SE) are highlighted by red circles, whereas other LCL genes are indicated by blue circles. Genes more highly expressed with endogenous LMP1 KO and TES1m rescue have higher x-axis values, whereas those more highly expressed with WT LMP1 rescue have lower values. P value <0.05 and >2-fold gene expression cutoffs were used.
(D) Volcano plot analysis of mRNA values in GM12878 expressing LMP1 sgRNA with TES2m versus WT LMP1 cDNA rescue, as in (C). Genes targeted by EBV super-enhancers (SE) are highlighted by red circles, whereas other LCL genes are indicated by blue circles. Genes more highly expressed with endogenous LMP1 KO and TES2m rescue have higher x-axis values, whereas those more highly expressed with WT LMP1 rescue have lower values. P value <0.05 and >2-fold gene expression cutoffs were used.

