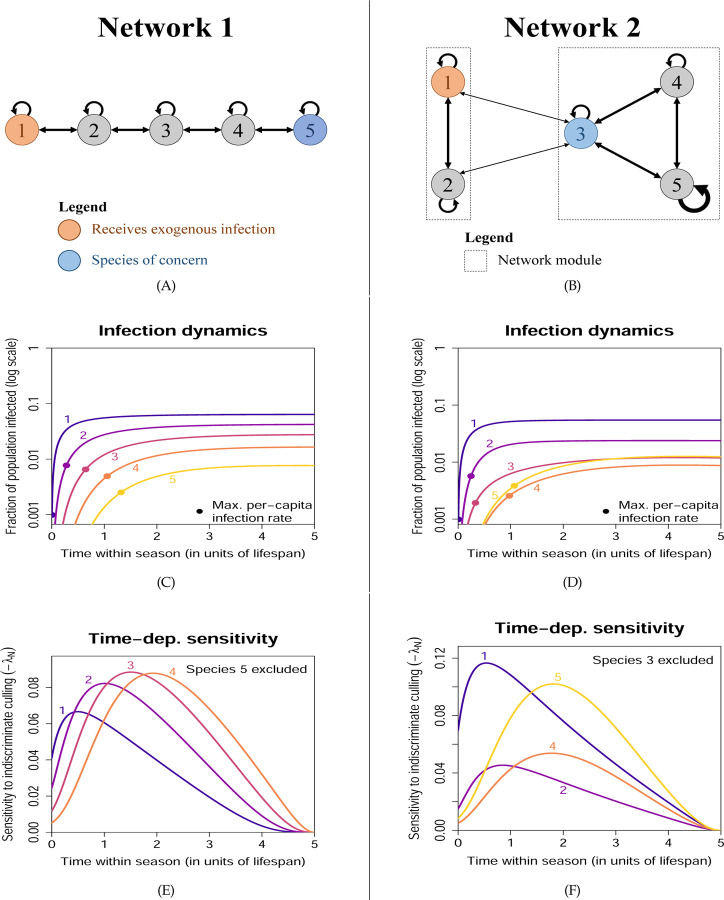
Figure 3: Time-dependent sensitivities to state perturbations from Example 1.
Each column corresponds to one network configuration. Disease spread is subcritical (R0 <1), so the disease is maintained by exogenous spillover. (A) and (B): Infection pathways; line thickness roughly scales with the size of the transmission coefficients bj,k. (C) and (D): Disease prevalence in each species. Each dot indicates when the per-capita rate of infection is the highest (note the vertical log scale). Despite the low infection prevalence in the species of concern, the population decline from disease-induced mortality can be substantial (see Figs. S1(B) and S2(B)). (E) and (F): Sensitivity of the reward function to indiscriminate culling (removal of random individuals regardless of infection status) of each species, excluding the species of concern.

