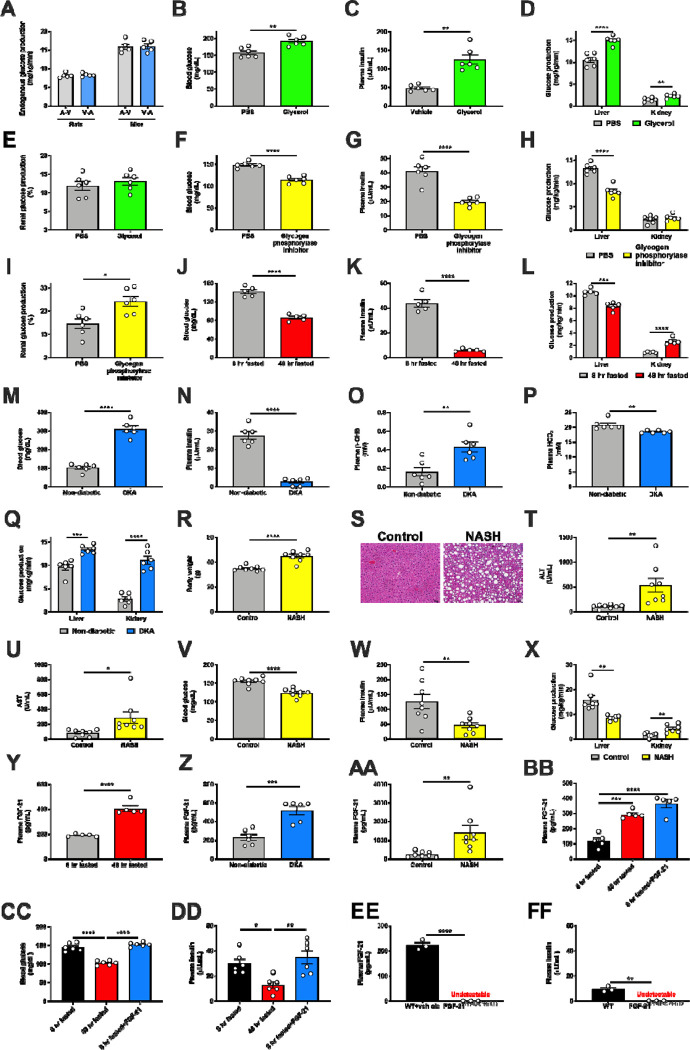
Extended Data Figure 1. FGF-21 promotes renal gluconeogenesis under conditions of metabolic stress.
(A) Measured endogenous glucose production is identical in rats and mice whether tracer is infused into the carotid artery and blood drawn from the jugular vein (A-V), or tracer is infused into the jugular vein and blood drawn from the carotid artery (V-A) (n=5 per group). (B)-(C) Blood glucose and plasma insulin concentrations in 6 hr fasted mice infused with glycerol, a gluconeogenic substrate (n=6 per group). (D)-(E) Hepatic and renal glucose production (n=6 per group). (F)-(G) Blood glucose and plasma insulin in 6 hr fasted mice treated with a glycogen phosphorylase antagonist to inhibit glycogenolysis (n=6 per group). (H)-(I) Hepatic and renal glucose production (n=6 per group). (J)-(K) Blood glucose and plasma insulin in recently fed (8 hr fasted) and starved (48 hr fasted) mice (n=5 per group). (L) Hepatic and renal glucose production (n=5 per group). (M)-(P) Blood glucose, plasma insulin, β-OHB, and bicarbonate in a mouse model of diabetic ketoacidosis (n=6 per group). (Q) Hepatic and renal glucose production (n=6 per group). (R)-(S) Body weight and liver hematoxylin & eosin staining in a mouse model of NASH (n=8 per group). Scale bar, 100 μm. (T)-(U) Liver transaminase concentrations (n=8 per group). (V)-(W) Blood glucose and plasma insulin (n=8 per group). (X) Hepatic and renal glucose production (n=7 per group). (Y)-(AA) Plasma FGF-21 concentrations in fed/fasted (n=5 per group), DKA (n=6 per group), and NASH models (n=8 per group). (BB)-(DD) Plasma FGF-21 (n=5 per group), blood glucose (n=6 per group), and plasma insulin concentrations (n=6 per group) in recently fed, fasted, and FGF-21 infused rats. *P<0.05, **P<0.01, ***P<0.001, ****P<0.0001 by ANOVA with Tukey’s multiple comparisons test. (EE)-(FF) Plasma FGF-21 and insulin concentrations in FGF-21f/f;Alb-CreERT2 mice and their WT littermates fasted for 48 hr (n=3 per group). In all panels, *P<0.05, **P<0.01, ***P<0.001, ****P<0.0001 by the 2-tailed unpaired Student’s t-test.

