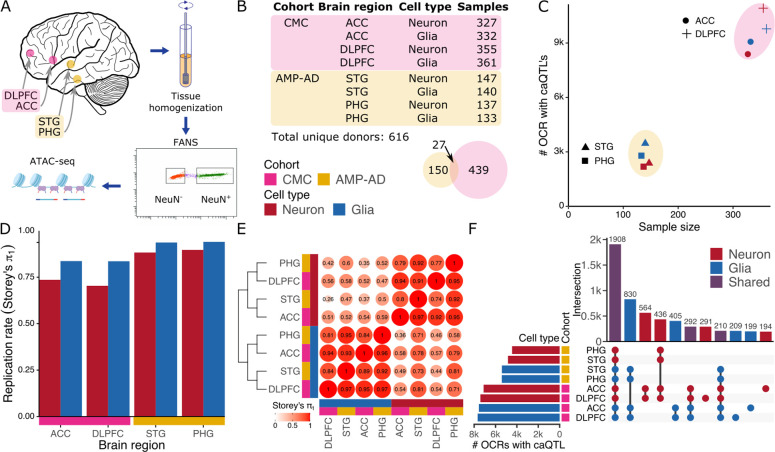
Figure 1: Cell-type specific regulation of chromatin accessibility.
A) Experimental workflow including brain dissection, tissue homogenization, fluorescence-activated nuclear sorting (FANS) using the NeuN marker followed by ATAC-seq. B) Counts of donors and tissue samples for two cohorts, four brain regions and two cell types. Venn diagram shows donor count for each cohort along with a very small overlap. C) Number of OCRs with detected caQTLs compared to their sample size for each of 8 data subsets. Color indicates cell type, shape indicates brain region, and encompassing ellipse indicates cohort. D) Replication rate of caQTL’s discovered in each data subset in caQTL results from brain homogenate (19) using Storey’s π1 statistic (22). E) Replicate rate of caQTL’s across each pair of data subsets using Storey’s π1 statistic followed by hierarchical clustering. caQTL discovery was performed in the datasets along the columns and replication rate was measured in the datasets along the rows. F) Multivariate Bayesian meta-analysis identifies shared and cell type specific genetic regulatory effects on OCRs shared across cell types.

