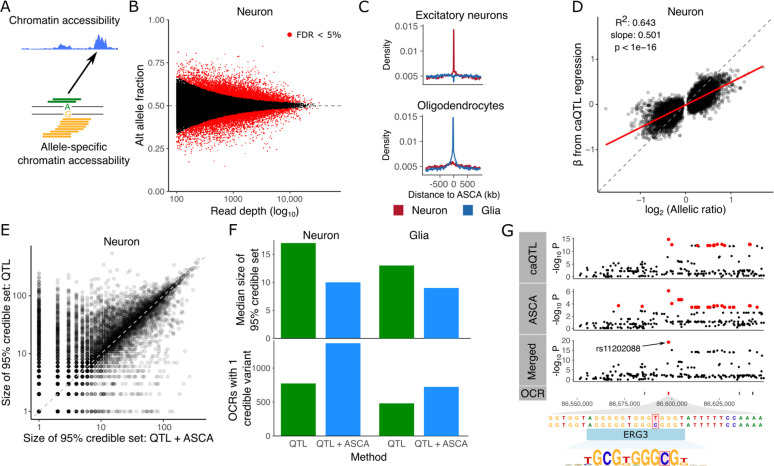
Figure 3: Allele specific chromatin accessibility.
A) Diagram illustrating chromatin accessibility along the genome (top) and allele specific chromatin accessibility (ASCA) inferred by allelic imbalance. B) ASCA was inferred by testing the null hypothesis of equal fraction of alternative and reference alleles. Here, power to detect weak effects increases with the read depth. Red points indicate genome-wide FDR < 5%. C) Enrichment of significant ASCA variants in OCRs detected from single nucleus ATAC-seq (23). D) Relationship between the regression slope β estimated from caQTL regression and the allelic ratio from ASCA analysis. E) Comparison of the size of the 95% credible set from caQTL and merged (caQTL and ASCA) analyses. Each point represents an OCR. F) Comparison of fine-mapping results between caQTL and merged (caQTL and ASCA) analyses showing median size of credible sets (top) and number of OCRs with a single credible variant (bottom) for neurons and glia. G) Results for neuronal OCR using caQTL regression method, ASCA, and merged (caQTL and ASCA) analyses. Using the merged analysis reduces the 95% credible set to a single SNP, rs11202088, in the OCR that is predicted to disrupt an ERG3 binding site. Variants in the 95% credible set are colored in red. OCR locations are shown and the target of the caQTL is colored red.

