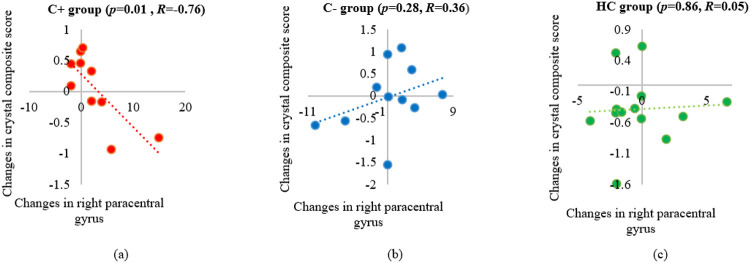
Figure 4.
Correlation of longitudinal changes between the right paracentral gyrification values and the crystallized composite scores. (a) chemotherapy (C+) group, (b) no-chemotherapy (C−) group, and (c) healthy control (HC) group. R: the Pearson’s correlation coefficient with significance set at p ≤ 0.05.

