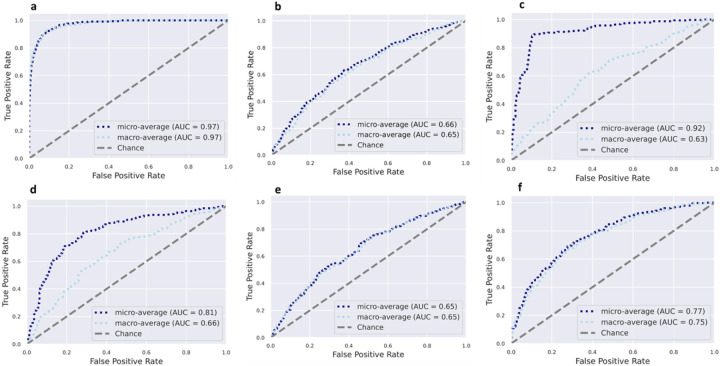
Figure 3. Receiver operating characteristic curves showing the classification accuracy of gut microbiota in a Random Forest model.
Classification accuracy for estimating (a). All countries (n=1694); (b) Obesity status (n=1694), (c). Diabetes status (n=1657); (d). Glucose status (n=1657); (e). Hypertensive status (1694); (f). Sex (n=1694) are presented. AUC= area under the curve

