
Figure 3.
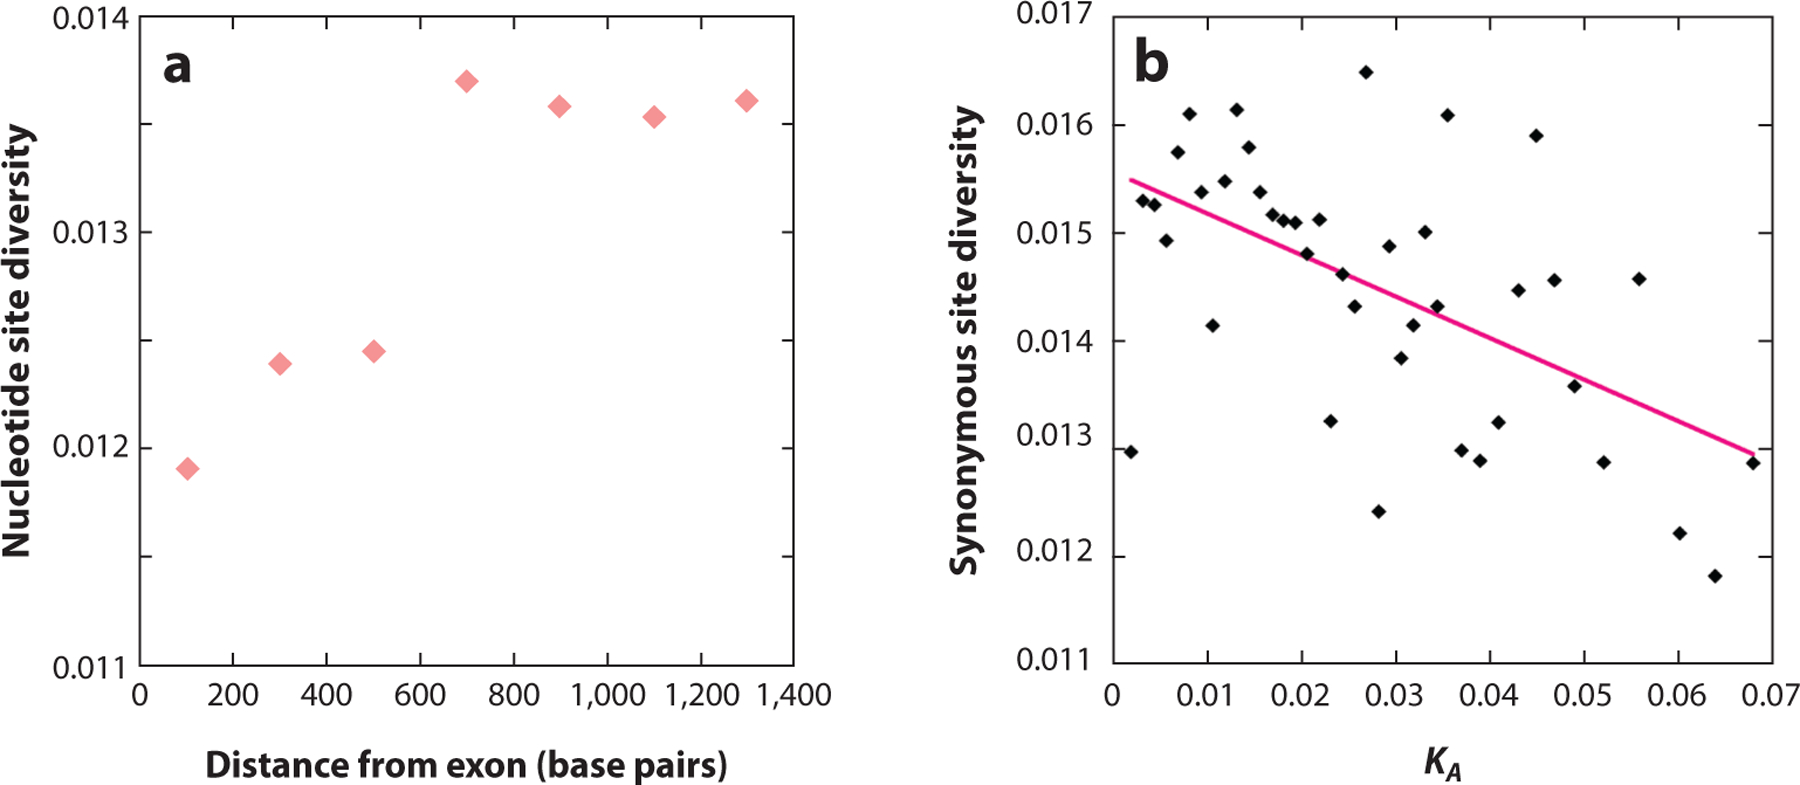
(a) The y-axis is the mean nucleotide site diversity in 200-bp sliding windows of intergenic sequence, and the x-axis is the distance of the middle of each window from the 5’ end of the exon. The data are for 94 single-exon genes sequenced in 76 haploid genomes from Drosophila melanogaster individuals sampled in Zambia; noncoding sites under strong selective constraints have been masked ( Johri et al. 2020). The Pearson correlation coefficient is r = 0.88, p < 0.01. (b) The points represent the mean synonymous site diversities of sets of autosomal genes from the Rwandan population of D. melanogaster used in Figure 1, grouped into 40 bins with respect to their divergence at nonsynonymous sites from the related species D. yakuba (KA). The solid pink line is the least-squares linear regression of diversity on KA (y = 0.0156 – 0.0385x, r =− 0.563, p < 0.001).