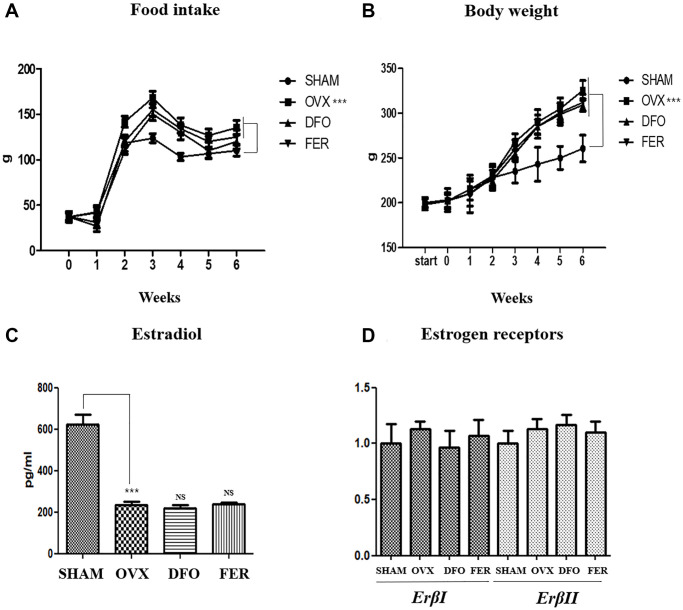
Figure 1.
Food intake, body weight, and sex hormone change. Food intake (A) and body weight (B) in each of the four groups. Food intake and body weight increased in the OVX group compared with the SHAM group, but there was no difference in the DFO and FER groups compared with the OVX group. (C) The level of serum estradiol concentration in each of the four groups. The serum estradiol levels were lower in the OVX group than in the SHAM group. Neither DFO nor FER treatment affected the serum estradiol level. (D) Quantitative real-time PCR analysis of ErβI and ErβII gene expression in the submandibular gland. The expression of ErβI and ErβII did not differ between the groups. Two-way ANOVA was performed. ***p < 0.001 vs. SHAM group. Abbreviations: NS: not significant; SHAM: sham surgery group; OVX: ovariectomized group; DFO: deferoxamine injection group; FER: ferrostatin-1 injection group; ER: estrogen receptor.

