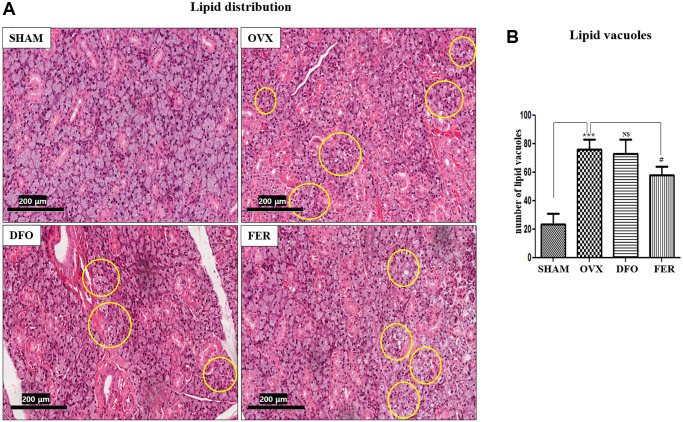
Figure 2.
Lipid deposition in the submandibular gland. (A) Lipid deposition in the submandibular gland (H&E staining, 40×). Yellow circles indicate lipid vacuoles. The lipid distribution increased in the OVX group and decreased in the FER group, but there was no significant difference in the DFO group. (B) Morphometric analysis of lipid vacuoles in the SHAM, OVX, DFO, and FER groups. Lipid vacuoles were significantly increased in the OVX group than in the SHAM group. The FER group exhibited decreased lipid vacuoles compared with the OVX group. Two-way ANOVA was performed. ***p < 0.001 vs. SHAM group, #p < 0.05, vs. OVX group. Abbreviations: NS: not significant; SHAM: sham surgery group; OVX: ovariectomized group; DFO: deferoxamine injection group; FER: ferrostatin-1 injection group.

