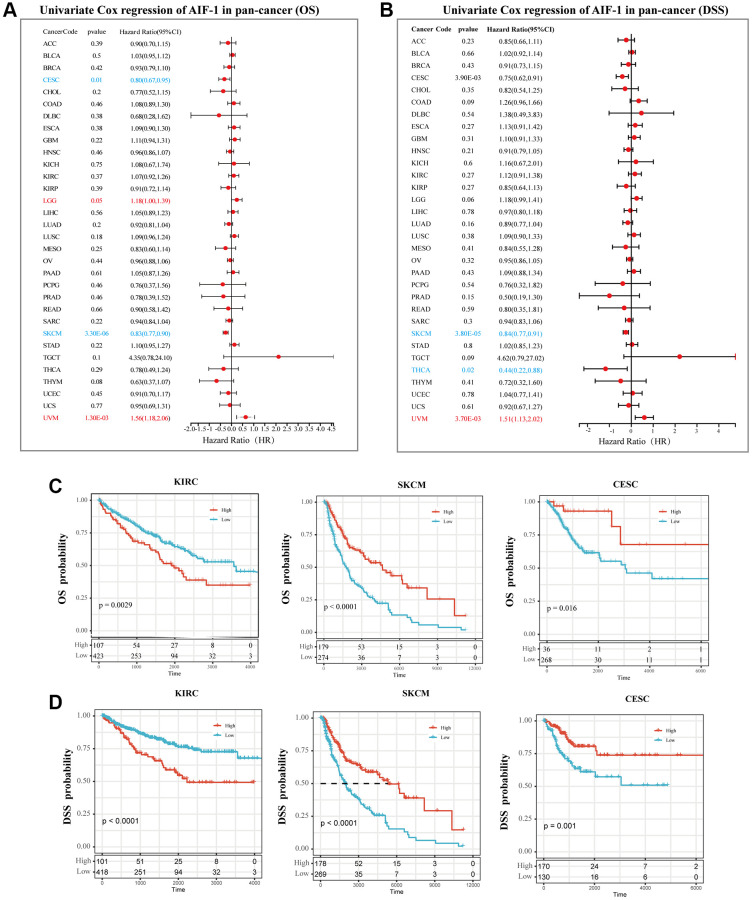
Figure 8.
Prognostic analysis of AIF-1 in pan-cancer. (A) The forest plot shows the association between AIF-1 expression and OS by the univariate Cox regression method. (B) The forest plot shows the association between AIF-1 expression and cancer DSS by the univariate Cox regression method. (C) Kaplan-Meier OS curves of AIF-1 in CESC, KIRC, and SKCM. (D) Kaplan-Meier DSS curves of AIF-1 in CESC, KIRC, and SKCM.

