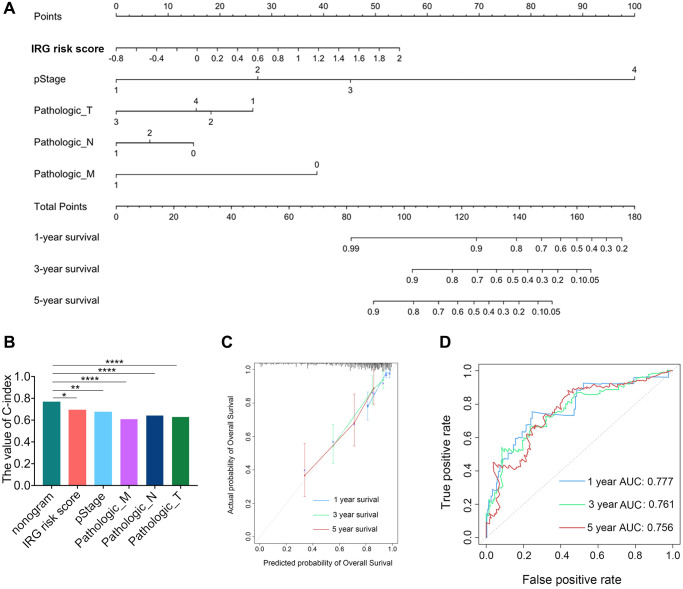
Figure 2.
Development and validation of the IRG risk score nomogram. (A) Development of the IRG risk score nomogram. (B) The C-index value of the IRG nomogram was significantly higher than the C-index of other constitutive factors. (C) The calibration plot exhibited wonderful agreement between prediction and observation in the probabilities of 1-, 3- and 5-year overall survival. (D) Receiver operating characteristic (ROC) curve of the IRG nomogram for 1-, 3- and 5-year overall survival in the TCGA dataset.

