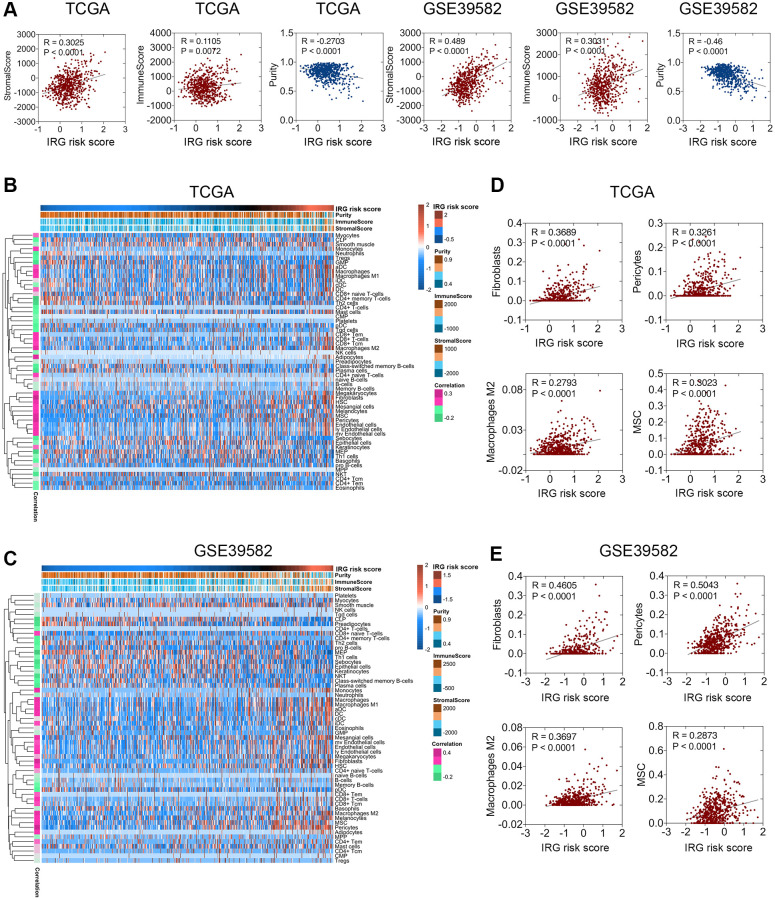
Figure 4.
Relationship between the IRG risk score and the CRC microenvironment. (A) The IRG risk score was positively correlated with stromal score but negatively correlated with tumor purity in the TCGA and GSE 39582 datasets. (B, C) xCell analysis showed extreme enrichment of stromal and immune cells with high IRG risk scores. (D, E) IRG risk scores were positively correlated with fibroblasts, pericytes, M2 macrophages, and MSCs in the TCGA (D) and GSE39582 (E) datasets.

