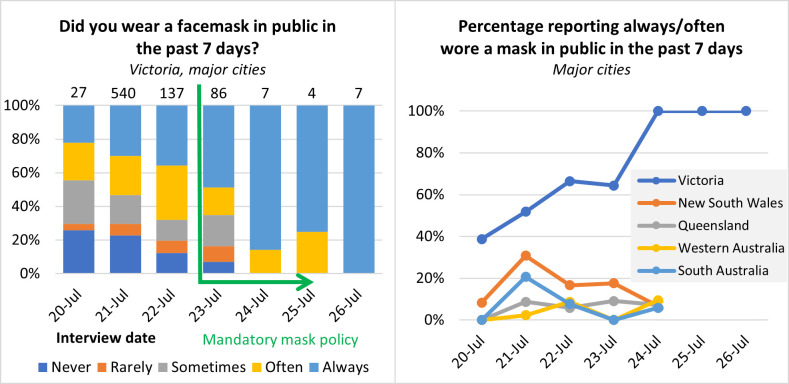
Fig 2. Results from the SCRUB survey.
Left: for Round 6 respondents (20–26 July) in Victorian Stage 4 restriction areas, reported frequency of mask use in the past 7 days. Numbers on top of bars represent total respondents. Right: the percentage of respondents who reported always or often wearing a mask over time, Victorian Stage 4 restriction areas and compared to major cities in other states. The number of respondents varied from survey to survey and state to state but averaged 38.6 for each state and time point and the details are listed in S1 File.

