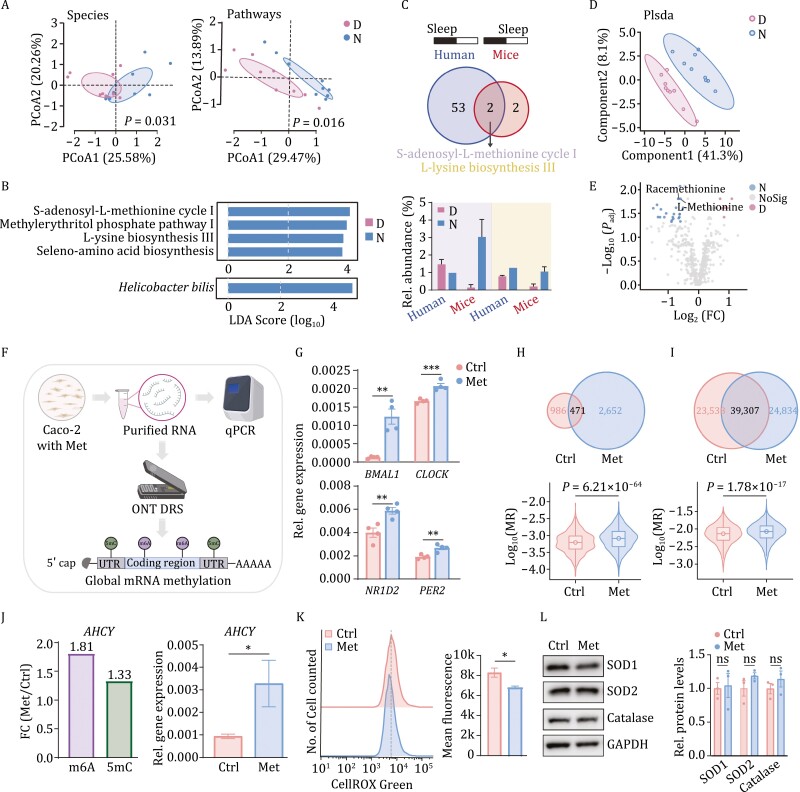
Figure 1.
Key gut microbial metabolite with circadian oscillation identifying and its potential effects on Caco-2 cell. (A) Significant day-night differences were observed in both composition (left panel) and function (right panel). D: daytime; N: nighttime. The significances of how two group can be distinguished were calculated using envfit function in vegan package in R. (B) Specie (bottom panel) and pathways (top panel) showed significant day-night difference (LDA score [log10] < −2 or > 2; Padj < 0.05). (C) The intersection of metabolic pathways with day-night difference of mouse gut microbiome in this study and that of human gut microbiota in our previous in situ study (Liu et al., 2021) identified two shared metabolic pathways (top panel) and S-adenosyl-l-methionine (SAM) cycle I showed a same activity oscillation pattern, namely increased metabolic activity during wake phase of both human (day) and nocturnal mice (night), and reversely in the sleep phase (bottom panel). Different colors indicate the two shared pathways, the purple one representing S-adenosyl-l-methionine cycle I and the yellow one referring to l-lysine biosynthesis III. The “sleep” in the top panel indicates sleep phase of human or mouse. (D) Metabolomic profiling showed alterations between day and night fecal samples. (E) Twenty-four metabolites with night preference and eight accumulating during the daytime were identified with fold change (FC) < 0.5 or > 2; Padj < 0.05. (F) The simple workflow of relative expression of for core clock genes in methionine-treated Caco-2 cells with Quantitative Real-time PCR (qPCR) and the cellular mRNA methylation level detecting with Oxford Nanopore technology direct RNA sequencing (ONT DRS). (G) The relative gene expression of four circadian clock genes, namely BMAL1, CLOCK, NR1D2, PER2 were detected in Caco-2 cells after vehicle (10% PBS) or 100 μmol/L methionine (Met group) treated for 24 h. (H) More m6A modified sites (top panel) and higher overall levels of m6A modification rate (MR, bottom panel) were detected in Caco-2 cells under 100 μmol/L methionine treatment compared to the Ctrl (PBS-treated) group. (I) More 5mC modified sites (top panel) and higher overall levels of 5mC MR (bottom panel) were detected in Caco-2 cells under 100 μmol/L methionine treatment compared to the Ctrl group. (J) The increased mRNA methylation levels (left panel) and relative gene expression level (right panel) of AHCY were detected with fold change analysis and qPCR. (K) The cellular reactive oxygen species (ROS) levels significantly decreased by methionine treatment in Caco-2 cells with CellROX Green flow cytometry analysis. (L) Western blot analyses showed that methionine has no significant effect on all the three antioxidant enzymes, superoxide dismutase1 (SOD1), superoxide dismutase2, (SOD2) and catalase in Caco-2 cells. The “n.s.” means no significant different in relative protein levels of all the three antioxidant enzymes. Values are presented as means ± s.e.m. Statistical significance was declared at 0.05. *P < 0.05, **P < 0.01, ***P < 0.005, ****P < 0.001.

