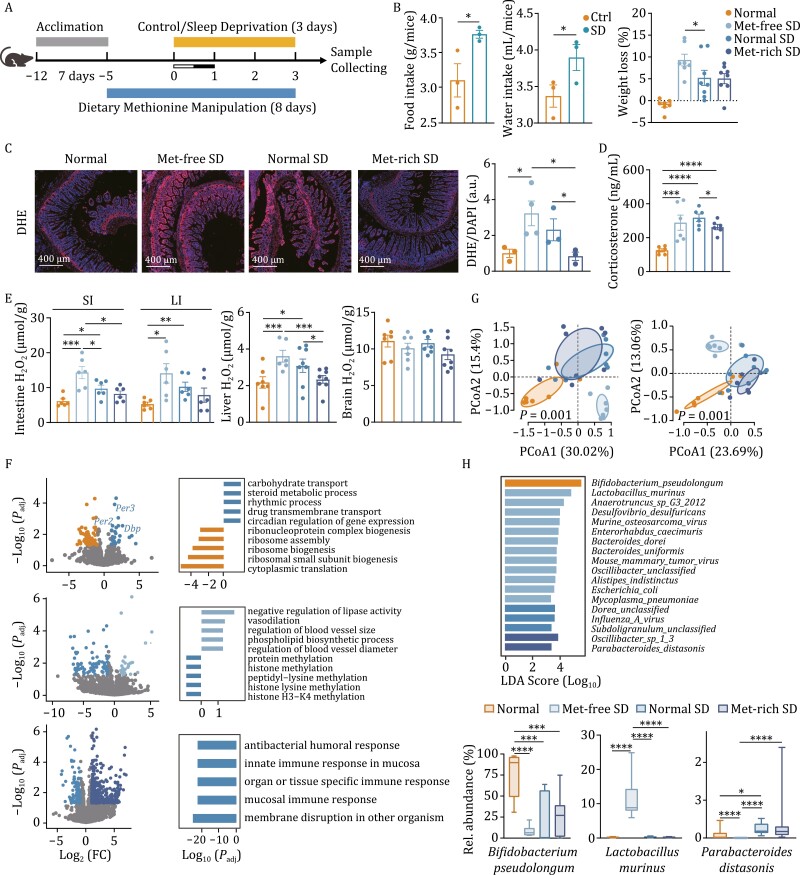
Figure 2.
Protective effects of methionine on a sleep-deprived mouse model. (A) Schematic diagram of the mice sleep deprivation (SD) study. (B) Food and water intake of three SD groups of mice before and during the SD period (left panel) and the weight loss of four groups during the SD period (right penal). SD had significantly increased diet intake; however, it significantly decreased mice body weight, especially for the Met-free group (0% methionine in diet). (C) DHE staining of mice small intestine. Higher ROS levels were seen in the small intestines after 3 days of SD and methionine deprivation/supplementation aggravated/relieved the ROS accumulation. The red channel refers to DHE and blue channel refers to DAPI. The right panel is the quantification of ROS levels. (D) Serum corticosterone levels of mice. Circulating corticosterone accumulated after SD and supplementation of methionine significantly reduced serum corticosterone levels. (E) H2O2 levels of intestines (Left panel), liver (middle panel), and brain (right panel) from SD and non-SD mice. SI means small intestine and LI presents large intestine. (F) RNA-seq analyses of small intestinal tissue of SD and non-SD mice. Volcano plots displaying differentially expressed genes in comparisons of Normal SD and Normal (top panel), Met-free SD and Normal SD (middle panel), Met-rich SD and Normal SD (bottom panel), respectively. Different colors represent different groups and the colored dots represent differentially expressed genes with log2 (FC) > 1, Padj < 0.05. The bar plots showing the most enriched biological functions (top 5) in GO enrichment analysis of differentially expressed gene in comparisons of Normal SD and Normal (top panel), Met-free SD and Normal SD (meddle panel), Met-rich SD and Normal SD (bottom panel), respectively. The significance declared at P < 0.05 and Padj < 0.20. (G) Principal coordinate analysis (PCoA) showing significant different in composition (left panel) and function (right panel) of SD and non-SD mouse gut microbiota. (H) The differential species across groups were identified with Linear discriminant analysis (LDA) effect size (LEfSe) analysis (top panel) with LDA score (log10) > 2 and Padj < 0.05 and the distributions of relative abundances of three important dominant species in the Normal, Met-free SD and Met-rich SD groups, respectively. Values are presented as means ± s.e.m. Statistical significance was declared at 0.05. *P < 0.05, **P < 0.01, ***P < 0.005, ****P < 0.001.

