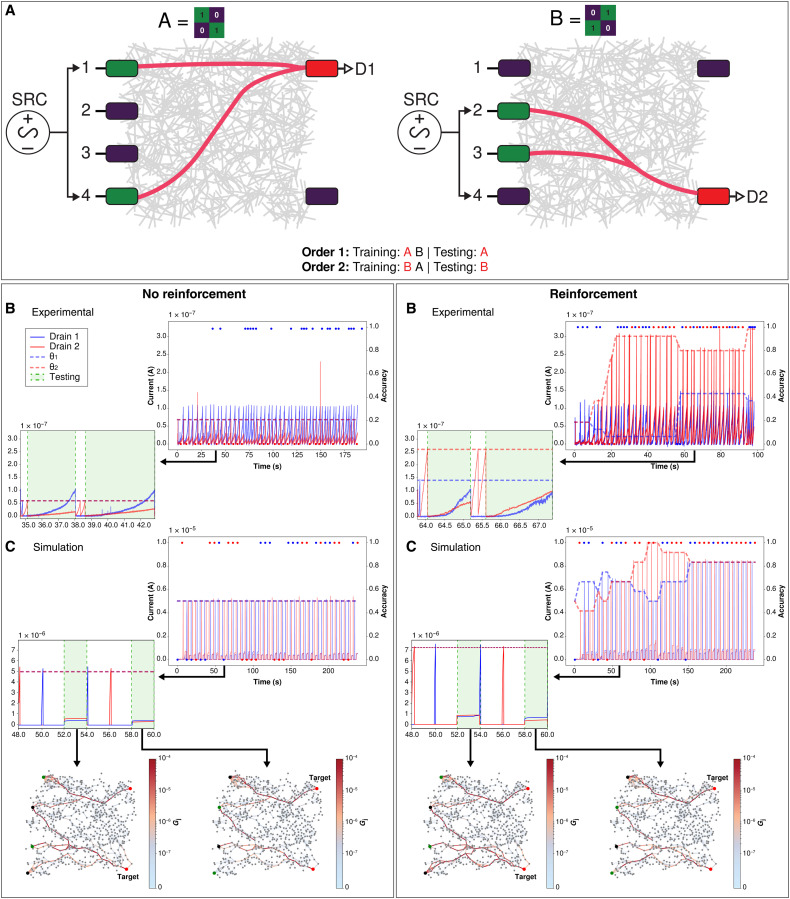
Fig. 2. Binary classification of 2 × 2 patterns with n = 2 (task 1).
Top: (A) Experimental setup schematic of training a NWN for two unique 2 × 2 patterns. Green electrodes represent active sources (inputs), purple electrodes are inactive, and red electrodes are active drains (outputs; D1 = drain 1, D2 = drain 2). Patterns can be presented in two possible orders (order 1 or 2), for each of which the target pattern is different. Bottom left: Without reinforcement: (B) Experimental results. Drain currents (solid blue and red lines, left axis) and classification accuracy (blue and red dots, right axis) versus time. Horizontal dashed lines represent training threshold θ1 for drain 1 (blue) and θ2 for drain 2 (red). Inset shows close-up of drain current over two training and testing (green shade) epochs in Δt = 35 to 43 s. During the first testing period (t = 35 to 38 s for no reinforcement and t = 64 to 65 s for reinforcement), order 1 is presented to the network. During the second testing period, order 2 is presented to the network. (C) Simulation results. Inset shows close-up of drain current over two epochs in Δt = 48 to 60 s. Simulated network visualization snapshots (nodes = nanowires and edges = junctions) showing junction conductance states (Gj, colorbar) during testing at t = 53.0 (drain 2 target) and t = 59.0 (drain 1 target). Active and inactive source nodes are in green and purple, respectively, with active drain nodes in red and target drain labeled. Bottom right: Same as left but with reinforcement. Insets show zoom-in over epochs in (B) Δt = 64 to 68 s and (C) Δt = 48 to 60 s.

