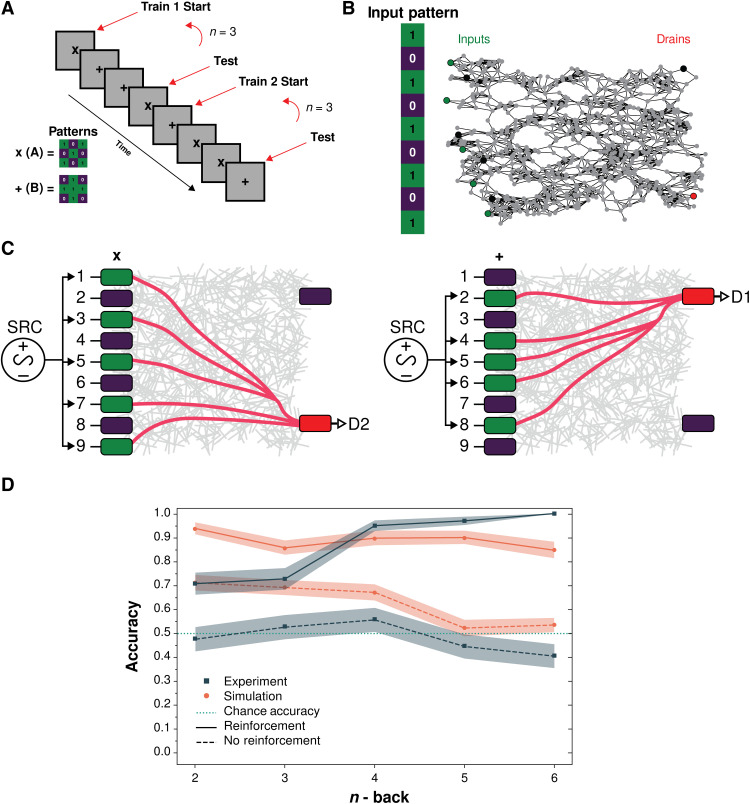
Fig. 3. Binary classification of 3 × 3 patterns for varying n (n ≥ 2) with and without physical reinforcement (task 2).
(A) Experimental schematic of task 2 n-back variation for two unique 3 × 3 patterns, “x” (pattern A) and “+” (pattern B), respectively. In epoch 1, x is presented during training as the target, followed by two (if n = 3) interference patterns +, and then x is presented again during testing. In epoch 2, the opposite order occurs. (B) Input pattern (as 1D vector) and corresponding input nodes of graphical network representation used in simulation with two drain nodes (target in red, nontarget in purple). (C) Same as Fig. 2A but for five voltage inputs (green) corresponding to 5-bit patterns x (left) and + (right). (D) Experimental (navy) and simulation (orange) results with (solid lines) and without (dashed lines) reinforcement. Chance accuracy (teal) is shown for comparison. Shaded areas represent SEM across epochs.

