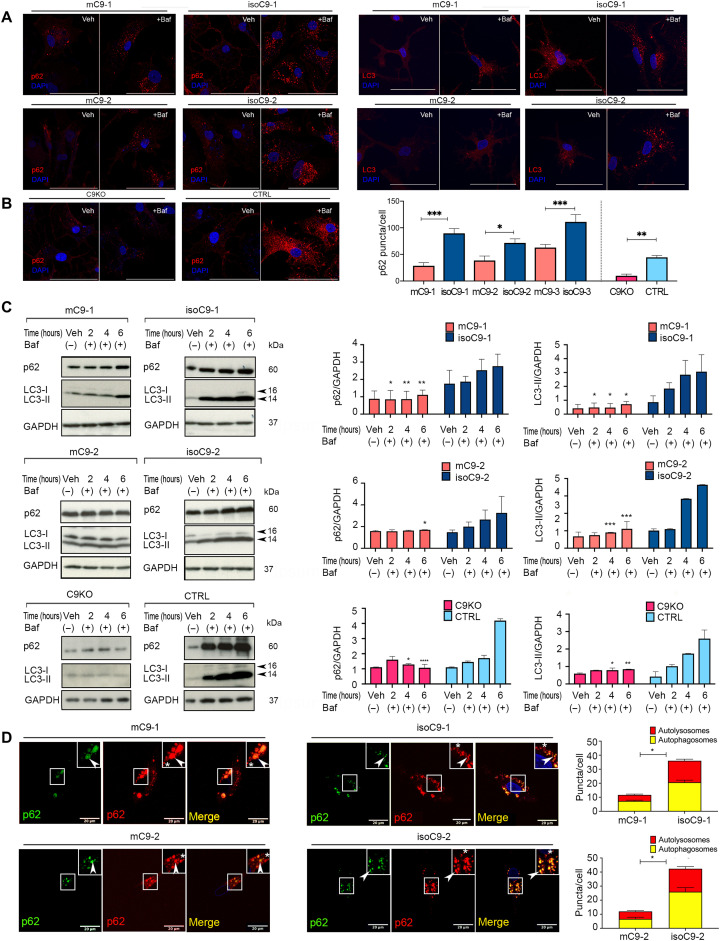
Fig. 4. mC9-MG demonstrate a deficit in the initiation of autophagy.
(A) Representative images of immunofluorescence staining of p62- (left) and LC3- (right)–positive puncta after 6 hours of dimethyl sulfoxide (DMSO) (vehicle control) and bafilomycin (Baf) treatment. (B) Representative images of immunofluorescence staining showing p62 + ve puncta at 6 hours after bafilomycin treatment in C9KO-MG when compared to CTRL-MG. Scale bars, 50 μm. Right: Bar graph demonstrating a reduced number of p62 + ve puncta per cell in mC9-MG and C9KO-MG after 6 hours of bafilomycin treatment. Data are represented as means ± SD; N = 3 (n = 20 cells per genotype). Statistical analysis was performed using two-way ANOVA and Tukey’s multiple comparisons test. **P < 0.05, **P < 0.01, and ***P < 0.001. (C) Representative immunoblots (left) showing the reduced turnover of p62 (~60 kDa) and LC3-II (~15 kDa) in two pairs of mC9-MG and C9KO-MG compared to their respective isoC9-MG and CTRL-MG in the presence of bafilomycin at 2, 4, and 6 hours. Bar graphs (right) represent the densitometric quantification of p62 and LC3-II normalized to loading control glyceraldehyde-3-phosphate dehydrogenase(GAPDH). Data are represented as means ± SD; N = 3. Statistical analysis was performed across mC9-MG, isoC9-MG and C9KO-MG, and CTRL-MG at 2, 4, and 6 hours using two-way ANOVA and Sidak’s multiple comparisons test. *P < 0.05, **P < 0.01, ***P < 0.001, and ****P < 0.0001. (D) Representative images from live imaging of mcherry-EGFP-p62 dual-reporter probe transduced in two pairs of mC9-MG and isoC9-MG; white arrowhead in the inset represents autophagosomes (GFP+, mCherry+) and white asterisk represents autolysosomes (GFP−mCherry+). Stacked bar graphs (right) demonstrating the quantification of autophagosomes and autolysosomes. Statistical analysis was performed using two-way ANOVA and Tukey’s multiple comparisons test for number of autophagosomes across mC9-MG and isoC9-MG. Data are represented as means ± SD; N = 3 [n(mC9-1 = 20 cells, mC9-2 = 18 cells, isoC9-1 = 20 cells, isoC9-2 = 20 cells)]; *P < 0.05. N represents the number of times experiments were performed using cells generated from independent iPSC differentiations.

