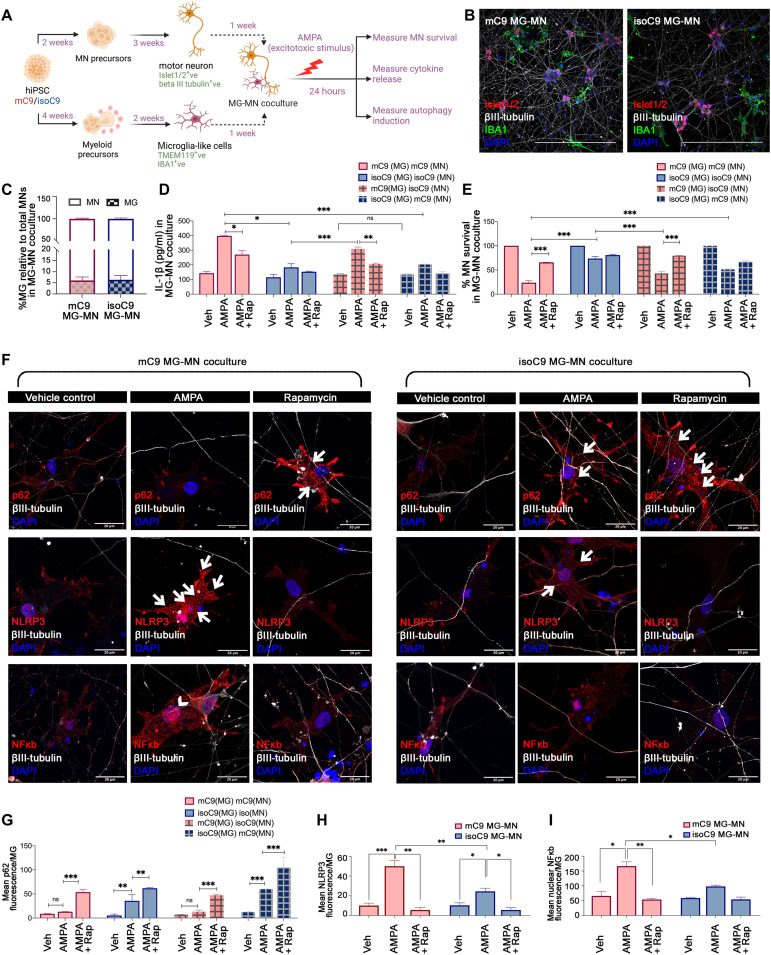
Fig. 8. Disrupted autophagy in mC9-MG contributes to enhanced motor neuronal death following excitotoxic insult.
(A) Schematic showing protocol for coculture of iPSC-derived MG and MNs (MG-MNs) to assess the impact of MG on MN survival, induction of autophagy in MG and cytokine release following excitotoxic stimulus (AMPA). (B) Representative immunofluorescence images of IBA1 (green) βIII-tubulin (gray) and Islet1/2 (red) in MG-MN coculture. Scale bars, 50 μm. (C) Graph representing percentage of MG relative to total MN in MG-MN coculture. Data are represented as means ± SD; N = 3. (D) Graph representing production of IL-1β in MG-MN cocultures in vehicle-treated condition, following AMPA challenge and in the presence of rapamycin. Data are represented as means ± SD; N = 3; *P < 0.05, **P < 0.01, and ***P < 0.001; ns, not significant. (E) Graphs showing percentage survival of MNs in MG-MN cocultures in vehicle-treated condition, following AMPA treatment and in the presence of rapamycin. Data are represented as means ± SD; N = 3. ***P < 0.001. (F) Representative images of fluorescence staining for microglial p62/NLRP3/NF-κB across vehicle-treated, AMPA-treated conditions and in the presence of rapamycin in MG-MN coculture. White arrows indicate the cytoplasmic localization of p62 and NLRP3 staining and arrowheads indicate the nuclear localization of NF-κB staining. Scale bars, 20 μm. (G) Graph representing the quantification of mean fluorescence intensity of p62 per microglial cell across vehicle-treated, AMPA-treated conditions and in the presence of rapamycin in MG-MN coculture. (H and I) Graph representing the quantification of the mean fluorescence intensity of NLRP3/NF-κB per microglial cell across vehicle-treated, AMPA-treated conditions and in the presence of rapamycin in MG-MN coculture. Twenty microglial cells from three biological replicates have been analyzed per condition against each genotype. Data are represented as means ± SD; N = 3. *P < 0.05, **P < 0.01, and ***P < 0.001; ns, not significant. N represents number of times experiments were performed using cells generated from independent iPSC differentiations.

