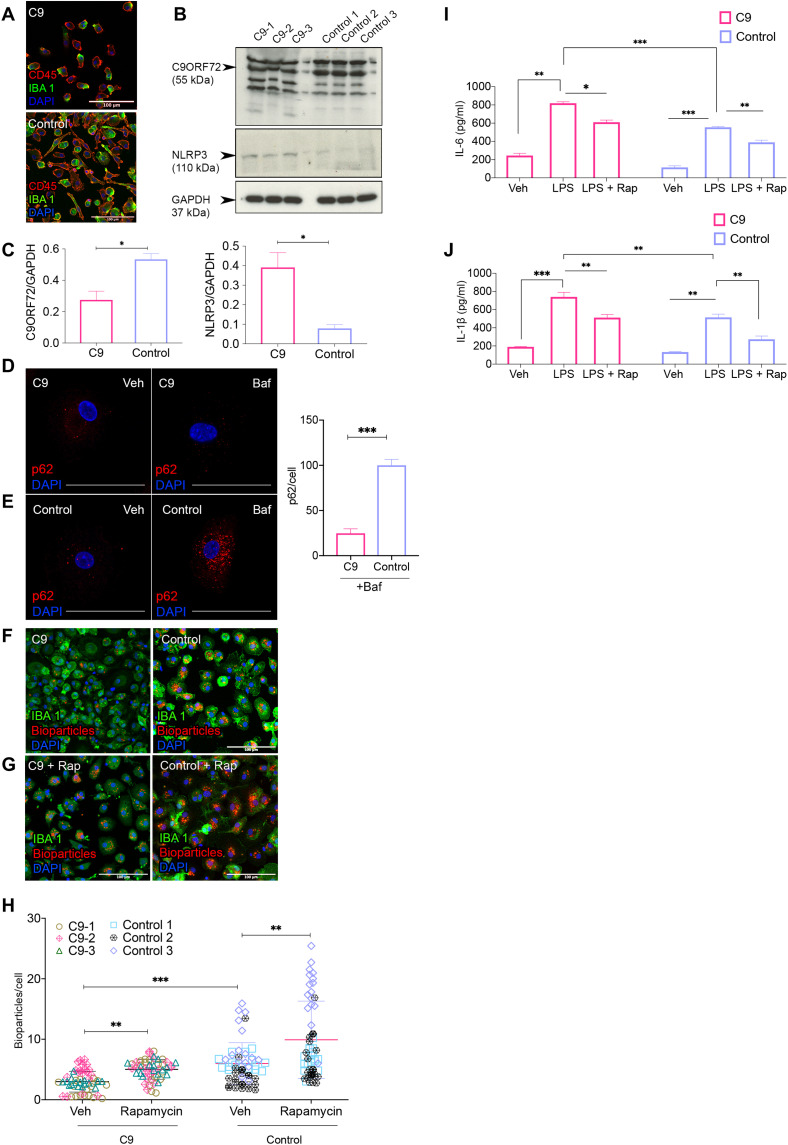
Fig. 9. Blood-derived macrophages isolated from people with the C9orf72 mutation recapitulate deficits observed in mC9-MGs.
(A) Representative images of immunofluorescence staining for CD45 and IBA-1 in C9-carrier and control PBMC-derived macrophages. Scale bars, 100 μm. (B) Immunoblot and (C) densitometric quantification demonstrating the reduced abundance of C9ORF72 (~55 kDa) (graph, left) and increased levels of NLRP3 (~110 kDa) (graph, right), in three C9 macrophage samples compared to control macrophages. Data are represented as means ± SD, and statistical analysis was performed using Student’s t test. *P < 0.05. (D and E) Representative images of immunofluorescence staining of p62-positive puncta after 6 hours of DMSO (vehicle control) and bafilomycin treatment. Scale bars, 50 μm. Graph demonstrating significantly fewer p62-positive puncta in C9 macrophages compared to control; statistical analysis was performed by Student’s t test. (F and G) Representative images of immunofluorescence staining showing phagocytosis assay performed with pH-sensitive zymosan bioparticles in C9 macrophages and control macrophages at 120 min [IBA-1 (green) and zymosan bioparticles (red)]. Scale bars, 50 μm. (H) Quantification of the number of internalized zymosan bioparticles at 120 min in C9 macrophages and control macrophages showing reduced phagocytosis in C9 macrophages; statistical analysis was performed using two-way ANOVA and Tukey’s multiple comparisons test (**P < 0.01 and ***P < 0.001), and data represent means ± SD across the pooled data from three C9-ALS cases with age-/sex-matched control. (I and J) ELISA for proinflammatory cytokines (IL-6 and IL-1β) across C9 macrophages and control macrophages in unstimulated and LPS-stimulated condition in the presence and absence of rapamycin, demonstrating exaggerated immune response in C9 macrophages following LPS stimulation. Statistical analysis was performed using two-way ANOVA and Tukey’s multiple comparisons test (*P < 0.05, **P < 0.01, and ***P < 0.001). Data are represented as means ± SD.

