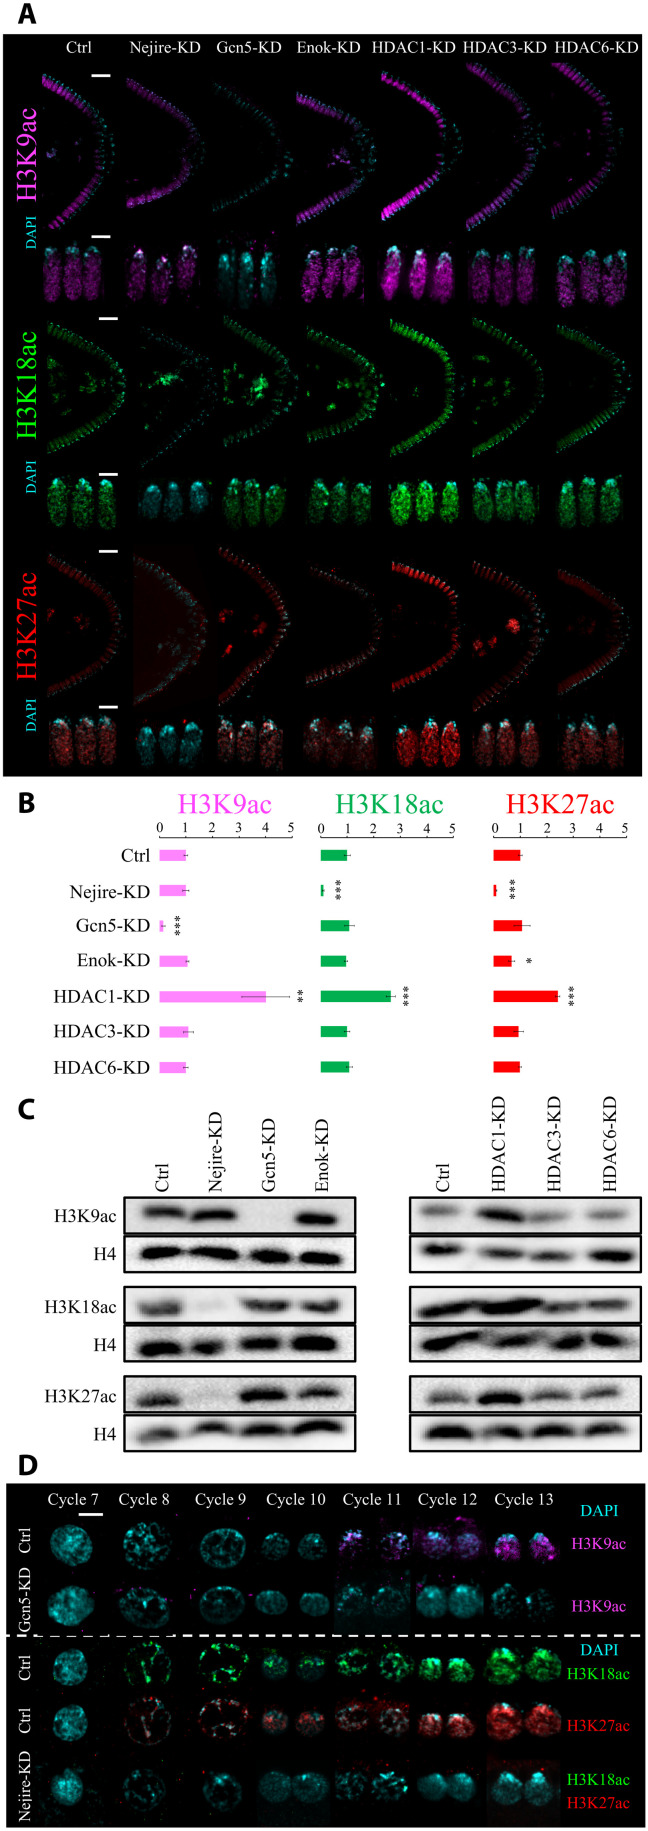
Fig. 3. Nejire, Gcn5, and HDAC1 regulate H3K9ac, H3K18ac, and H3K27ac levels during ZGA.
(A) Representative immunofluorescence pictures of ZGA (stage 5) control and KD embryos. From top to bottom: anti-H3K9ac staining (magenta), anti-H3K18 staining (green), and anti-H3K27ac staining (red) are coupled with DAPI staining (cyan). For each staining, posterior sides of ZGA embryos are displayed on the top (scale bars, 20 μm), and three nuclei are displayed on the bottom (scale bars, 5 μm). (B) Quantification of the immunofluorescence signal for anti-H3K9ac staining (magenta), anti-H3K18 staining (green), and anti-H3K27ac staining (red) in embryos at ZGA. Data represent the mean of n = 4 stage 5 embryos of DAPI-normalized immunofluorescence signals for each staining, compared to control embryos. Every data point consists of the mean signal obtained from five cross-sectional nuclei. Error bars represent the SD of the four independent embryos (*P ≤ 0.05, **P ≤ 0.01, and ***P ≤ 0.001; paired, two-tailed Student’s t test). (C) Western blot assays were performed with total protein extracts from ZGA embryos. H3K9ac, H3K18ac, and H3K27ac signals are compared with total H4 signal from the same blot. (D) Representative immunofluorescence pictures of interphase nuclei from cycle 7 to cycle 13 of embryogenesis. Scale bar, 5 μm. On the top, control embryos and Gcn5-KD embryos stained with anti-H3K9ac (magenta) and DAPI (cyan). On the bottom, control embryos stained with anti-H3K18ac (green) and DAPI; control embryos stained with anti-H3K27ac (red) and DAPI (cyan); Nejire-KD embryos stained with anti-H3K18ac (green), anti-H3K27ac (red), and DAPI (cyan).

