
FIGURE 3.
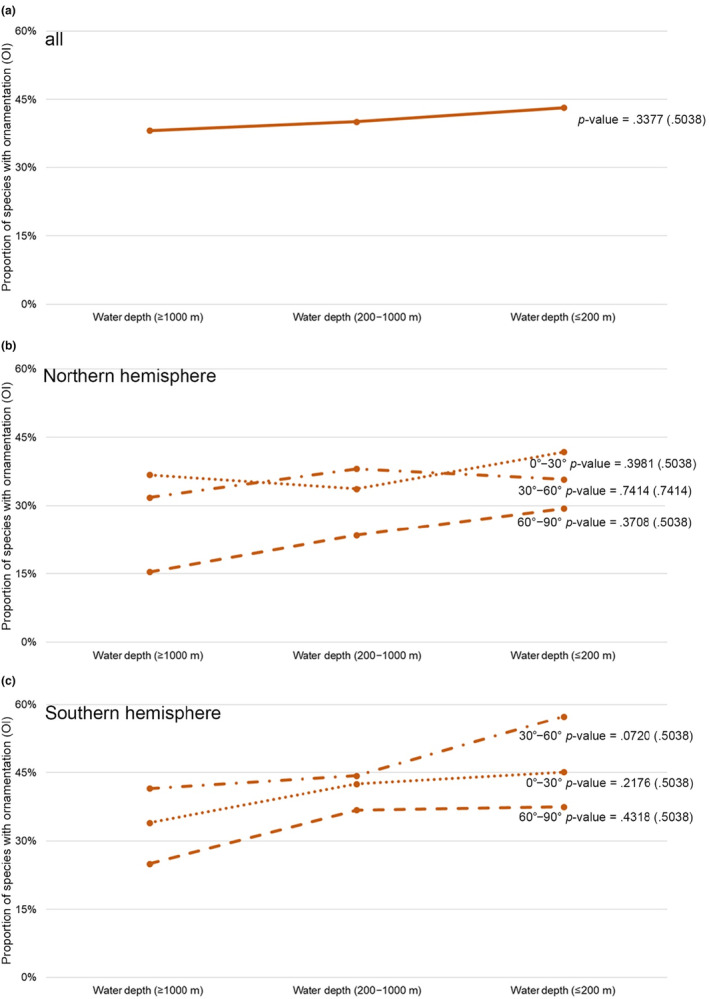
Variation of shell ornamentation index (expressed by OI) along the bathymetric gradient. (a) All data in three water depth intervals; (b) Northern hemisphere in three water depth intervals; (c) Southern hemisphere in three water depth intervals. Trend gradient and the corresponding p‐value were both tested by the Cochran–Armitage trend test, with adjusted p‐values shown in parentheses.