
FIGURE 4.
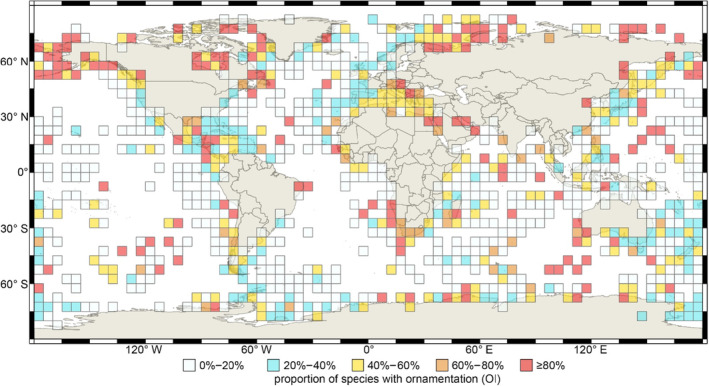
5° grid cell map of shell ornamentation index (expressed by OI) of living brachiopods. Different color represents the gradient of OI values as shown in the legend boxes. Source: global basic map was downloaded from ArcWorld Supplement via ESRI, then adapted for visualization here by using open‐source Geographic Information System QGIS (http://qgis.osgeo.org).