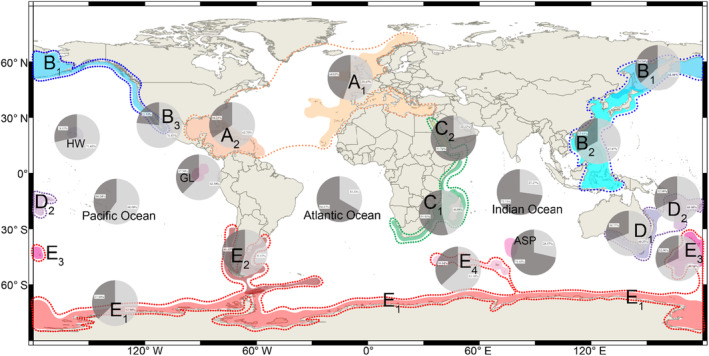
FIGURE 5.

Global map showing the variation of shell ornamentation index (expressed by OI) from different bioprovinces (Ye et al., 2021). Different colors from the pie chart indicate the proportion of OI (dark gray: with ornamentation, light gray: smooth).
