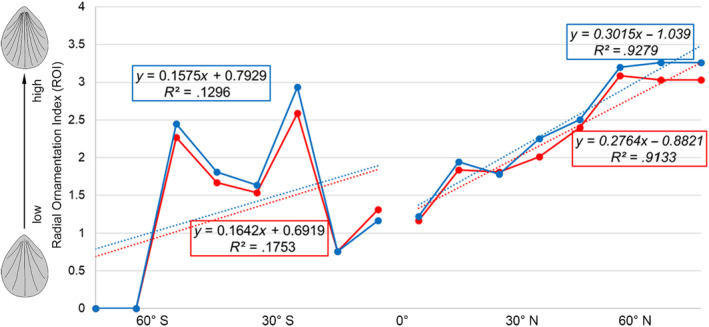
FIGURE 6.

The changes of the ROI along different latitudinal zones, showing the higher ROI, the denser radial ornamentation. The data from ventral valve: blue color, the data from dorsal valve: red color. Equation and corresponding R 2 value in italic indicate p‐value ≤.05.
