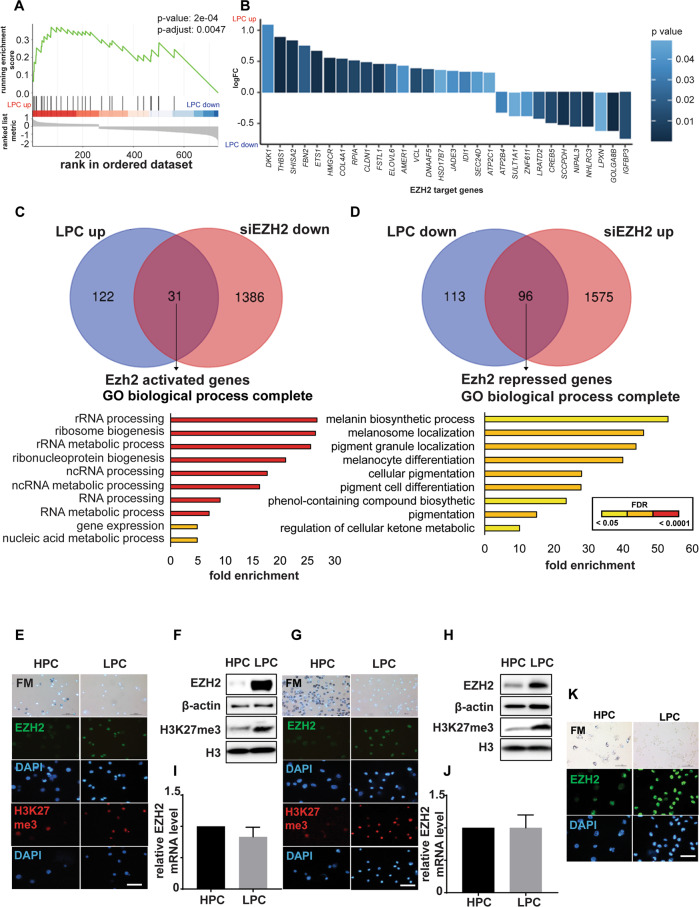
Fig. 1. EZH2 protein, but not EZH2 mRNA, is upregulated in LPCs.
A Gene set enrichment analysis (GSEA) showing upregulated EZH2 targets in LPCs isolated from 28:B4:F3 cells. The EZH2 target genes were defined as down-regulated upon knockdown of EZH2 [51]. A positive normalized enrichment score (NES) indicates gene set enrichment at the top of the ranked list, which includes genes upregulated in LPC compared to HPC. B. EZH2 target genes that were differentially expressed between LPC and HCP. Positive logFC indicates upregulation in LPC. C, D Venn diagrams showing overlap of significantly upregulated (C) or downregulated (D) genes in B16-F10 LPCs relative to HPCs, and of siEzh2-downregulated (C) or upregulated (D) genes in parental B16-F10 cells relative to scramble controls (FDR-adjusted p-value < 0.05, upper panels). Lower bars show GO term enrichment analysis of the 31 (C) and 96 (D) common genes, showing enriched functions (FDR-adjusted p-value < 0.05, lower panel; colour indicates p-values adjusted by false discovery rate (FDR) via the Benjamini-Hochberg procedure). E–J Bright-field (BF) microscopy of Fontana-Masson staining (upper panel) and immunofluorescence (IF) images probed for EZH2 (green) and H3K27me3 (red) in HPCs and LPCs from 28:B4:F3 (E) and B16-F10 (G) cells. Nuclei shown by DAPI (blue; lower panels). Scale bars: 50 µm. To right of each set of images are shown endogenous EZH2 and H3K27me3 protein levels in HPCs and LPCs measured by western blot in (F) 28:B4:F3 and (H) B16-F10 cells, and EZH2 mRNA levels in HPCs and LPCs in (I) 28:B4:F3 and (J) B16-F10 cells. K BF microscopy of Fontana-Masson staining (upper panel) and IF images probed for EZH2 (green) and H3K27me3 (red) in HPCs and LPCs from a pigmented patient-derived xenograft melanoma. Nuclei shown by DAPI (blue; lower panels). Scale bar: 50 µm. n = 3 biological replicates.

