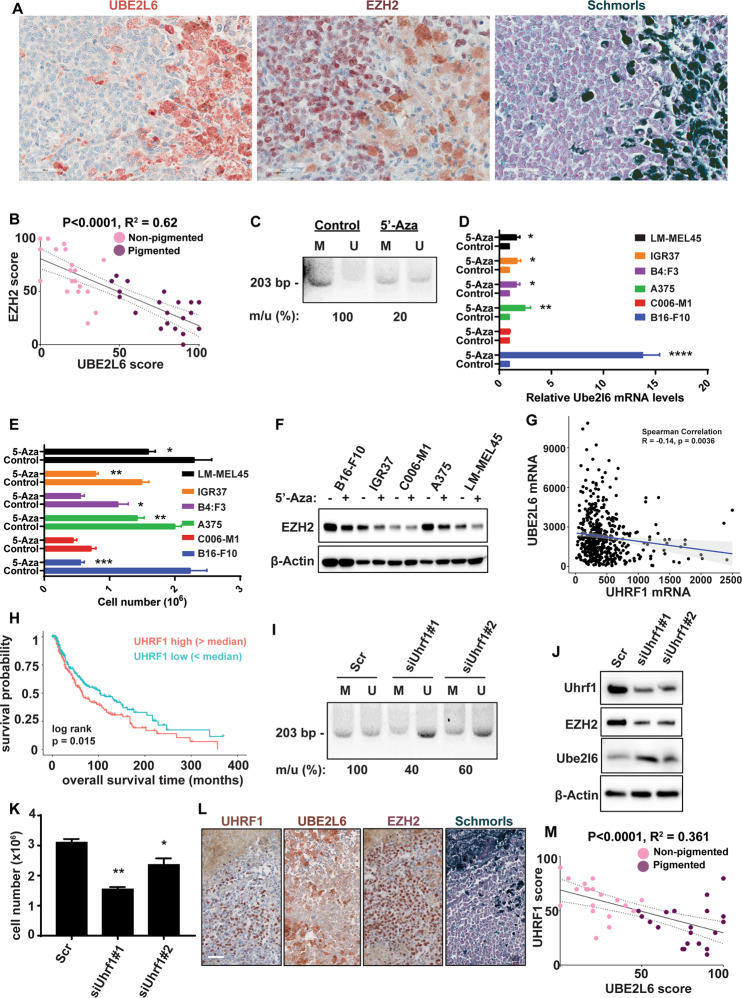
Fig. 4. UBE2L6 promoter methylation via UHRF1 depletes UBE2L6 and stabilizes EZH2.
A Immunohistochemical staining of EZH2 and UBE2L6 in representative Schmorl’s stained pigmented human melanomas. Scale bar: 50 μm. B UBE2L6 protein scores (x-axis) negatively correlated with EZH2 protein scores (y-axis) in patient melanomas. Pink dots correspond to non-pigmented and purple dots to pigmented patient samples. p-value calculated from a linear regression analysis. R = correlation coefficient. Protein score = the percentage of immunopositive cells × immunostaining intensity. C–F Indicated cell lines were treated with 2 µM 5’-Azacitidine or DMSO (vehicle) for 72 h prior to: (C) methylation specific primer (MSP) analysis of methylation at the UBE2L6 promoter (M: Methylated specific primer; U: Unmethylated specific primer; number below image represents percent ratio of methylated (m) to unmethylated (u) DNA quantified by ImageJ after normalization to controls (m/u), (D) UBE2L6 mRNA quantification with RT-qPCR, (E) cell number by Trypan blue cell counting, and (F) EZH2 protein quantification with western blot. G Correlation between UBE2L6 and UHRF1 mRNA levels in TCGA cutaneous melanoma samples. H Kaplan-Meier curves of overall survival of TCGA cutaneous melanoma patients (n = 427) stratified by UHRF1 mRNA levels. p = 0.015 (log-rank test). I–K A375 human melanoma cells were transfected with one of two siRNAs against Uhrf1, or scrambled controls, followed by: (I) MSP analysis of UBE2L6 promoter as in (C), (J) EZH2 and UBE2L6 protein estimation by western blot, and (K) cell number by Trypan blue cell counting. L Immunohistochemical staining of UHRF1 and UBE2L6 in representative Schmorl’s stained pigmented human melanomas. Scale bar, 50 μm. M UBE2L6 protein scores (x-axis) in melanoma samples negatively correlated with UHRF1 scores (y-axis) in individual patients. Pink dots correspond to non-pigmented and purple dots to pigmented patient samples. P-value calculated from linear regression analysis. R = correlation coefficient. Protein score = percentage of immunopositive cells × immunostaining intensity. Data for D, E and K from three independent experiments are presented as means ± SD, analyzed by one-way ANOVA plus Tukey’s multiple comparison test. *p < 0.05, **p < 0.01, ***p < 0.001, ****p < 0.0001.

