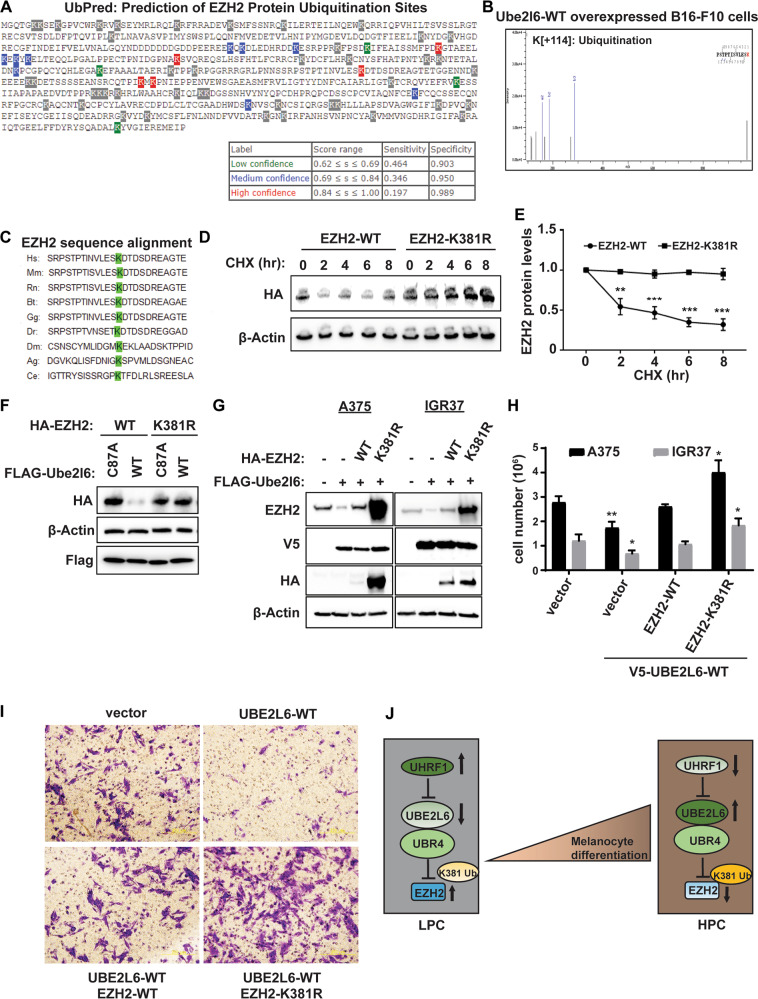
Fig. 6. The K381 residue on EZH2 is ubiquitinated by UBE2L6/UBR4 in melanoma cells.
A Prediction of ubiquitination sites on human EZH2 was made using UbPred, shown as low (green), medium (blue) and high (red) confidence lysine ubiquitination sites (www.ubpred.org) (B) LC-MS analysis of mouse Ezh2 K376 ubiquitination in B16-F10 cells. C Sequence alignment of residues 368–392 of human (Hs) EZH2 protein against Mus musculus (Mm, mouse), Rattus norvegicus (Rn, rat), Bos taurus (Bt, cow), Gallus gallus (Gg, chicken), Danio rerio (Dr, zebrafish), Drosophila melanogaster (Dm, fruit fly), Anopheles gambiae (Ag, mosquito), and Caenorhabditis elegans (Ce, worm) showing conservation of K381 residues. D HEK293 cells with HA-tagged EH2-WT or HA-tagged EZH2-K381A were treated with 50 µg/mL CHX (cycloheximide) for the durations indicated. Stability of HA-tagged EZH2 protein was determined by western blot with anti-HA antibody. E Quantitated time course of EZH2 protein levels from (D). F B16-F10 cells were transfected with either Flag-tagged Ube2l6-WT or Flag-tagged Ube2l6-C87A (mutant) and HA-tagged EZH2-WT or HA-tagged EZH2-K381A, and HA-EZH2 levels determined by western blot with anti-HA antibody. G A375 and IGR37 cells transduced with V5-UBE2L6-WT were transfected transiently with either HA-tagged EZH2-WT or HA-tagged EZH2-K381R. Endogenous EZH2 levels were determined 48 h post-transfection with EZH2 antibody, HA-EZH2 levels were determined with anti-HA antibody and V5-UBE2L6 levels with V5 antibody. H Cells treated as in (G) were counted by Trypan blue 48 h post-transfection. I Invasion of cells treated as in (G) was measured 72 h post-transfection using Boyden chamber matrigel invasion assays followed by crystal violet staining. J Proposed model for UHRF1/UBE2L6/UBR4-mediated regulation of EZH2 and thereby melanocytic differentiation phenotypes in melanoma. Data for E and H from three independent experiments are presented as means ± SD, analyzed by one-way ANOVA plus Tukey’s multiple comparison test. *p < 0.05, **p < 0.01, ***p < 0.001.

