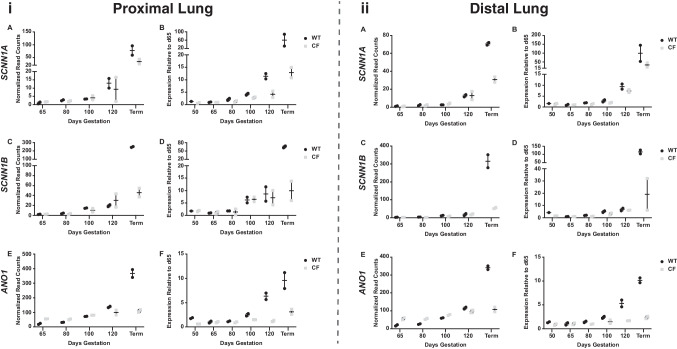
Fig. 4.
Developmental profiles of ion channel gene expression in WT and CFTR−/− sheep proximal and distal lung. SCNN1A, SCNN1B, and ANO1 expression is shown. Data on the left are expression profiles in proximal lung and on the right in distal lung. Normalized read counts from RNA-seq data in A, C, and E. RT-qPCR validation of expression in B, D, and F with values relative to expression at 65 days. WT samples are black dots and CFTR−/− (CF) samples are grey squares. Values plotted are from 2 biological replicates at each time point for RNA-seq and the mean of technical replicates for each biological sample for RT-qPCR

