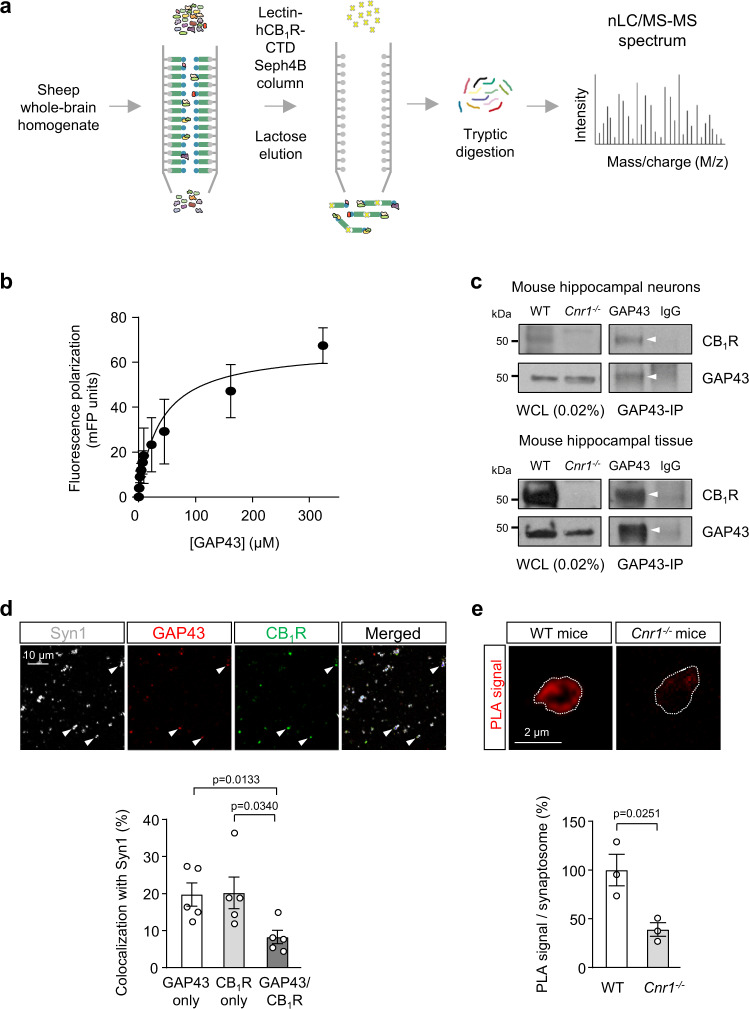
Fig. 1. GAP43 interacts with CB1R.
a Schematic workflow of the affinity purification and tandem MS/MS experiment conducted. A sheep whole-brain homogenate was loaded onto a lectin-hCB1R-CTD-bound Sepharose 4B column. After washing, elution with lactose, eluted-fraction separation by SDS-PAGE, and digestion with trypsin, peptides were subjected to nLC/MS-MS proteomic analysis. b Fluorescence polarization (FP)-based protein–protein binding experiments using 5-IAF-labeled CB1R-CTD and increasing amounts of unlabeled GAP43. FP was expressed as milli-FP units. Each point represents the mean ± SEM of 3 independent experiments. c Co-immunoprecipitation experiments in (top) primary mouse hippocampal neurons or (bottom) mouse hippocampal tissue. Immunoprecipitation (IP) was conducted with anti-GAP43 antibody or control IgG. Arrowheads point to specific precipitated bands. Whole-cell lysates (WCL) from 3-month-old WT and control Cnr1−/− mice are shown. A representative experiment is shown. The experiment was repeated independently 3 times with similar results. d Top, Representative confocal images of hippocampal synaptosomes of WT mice immunostained for synaptophysin 1 (Syn1), GAP43 and CB1R. Arrowheads point to representative triple-colocalizing synaptosomes. Bottom, Quantification of the percentage of Syn1+ synaptosomes that colocalize with either CB1R only, GAP43 only, or both CB1R and GAP43 (means ± SEM; n = 5 independent synaptosomal preparations; two-tailed unpaired Student’s t test). e PLA for CB1R and GAP43 was performed in hippocampal synaptosomes from WT mice and Cnr1−/− mice as control. Representative confocal images of CB1R-GAP43 complexes appearing as red signal (top), and quantification of PLA-positive signal per synaptosome (bottom; means ± SEM; n = 3 independent synaptosomal preparations per genotype; two-tailed unpaired Student’s t test). Source data are provided as a Source data file.

