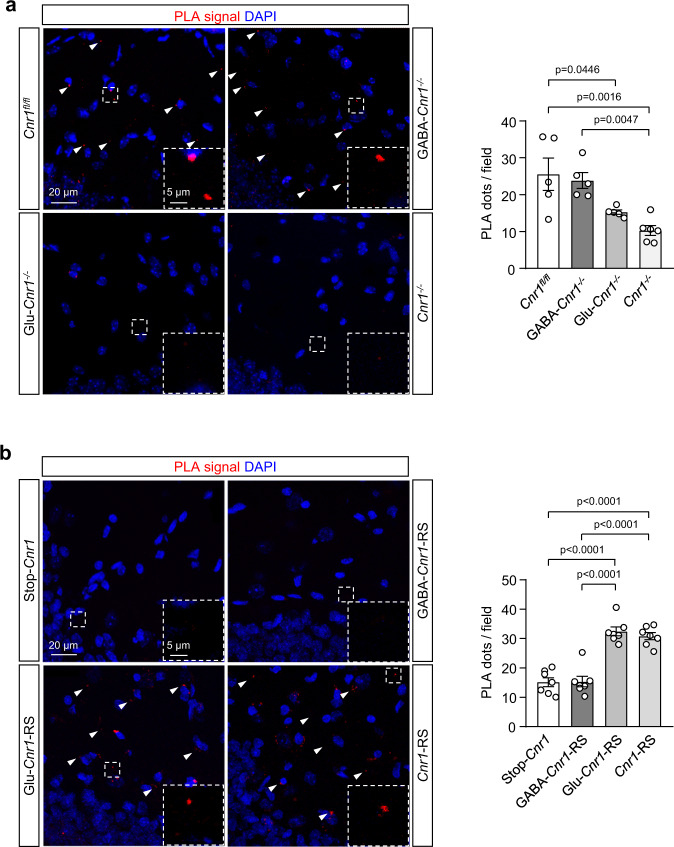
Fig. 3. GAP43 interacts with CB1R in MC axon terminals of the DG.
PLA experiments were performed in hippocampal sections from 3-month-old mice of different genotypes. CB1R-GAP43 complexes are shown as PLA-positive red dots. Nuclei are stained with DAPI (blue). a Representative images of DG-IML sections from Cnr1fl/fl, GABA-Cnr1−/−, Glu-Cnr1−/−, and full Cnr1−/− mice. Arrowheads point to some of the complexes. Inset magnifications are included for each genotype. Quantification of PLA-positive dots per field is shown (right, means ± SEM; Cnr1fl/fl n = 5 mice, GABA-Cnr1−/− n = 5 mice, Glu-Cnr1−/− n = 5 mice, Cnr1−/− n = 6 mice; one-way ANOVA with Tukey’s multiple comparisons test). b Representative images of DG-IML sections from Stop-Cnr1, GABA-Cnr1-RS, Glu-Cnr1-RS, and Cnr1-RS mice. Arrowheads point to some of the complexes. Inset magnifications are included for each genotype. Quantification of PLA-positive dots per field is shown (right, means ± SEM; n = 7 mice per group; one-way ANOVA with Tukey’s multiple comparisons test). Source data are provided as a Source data file.

