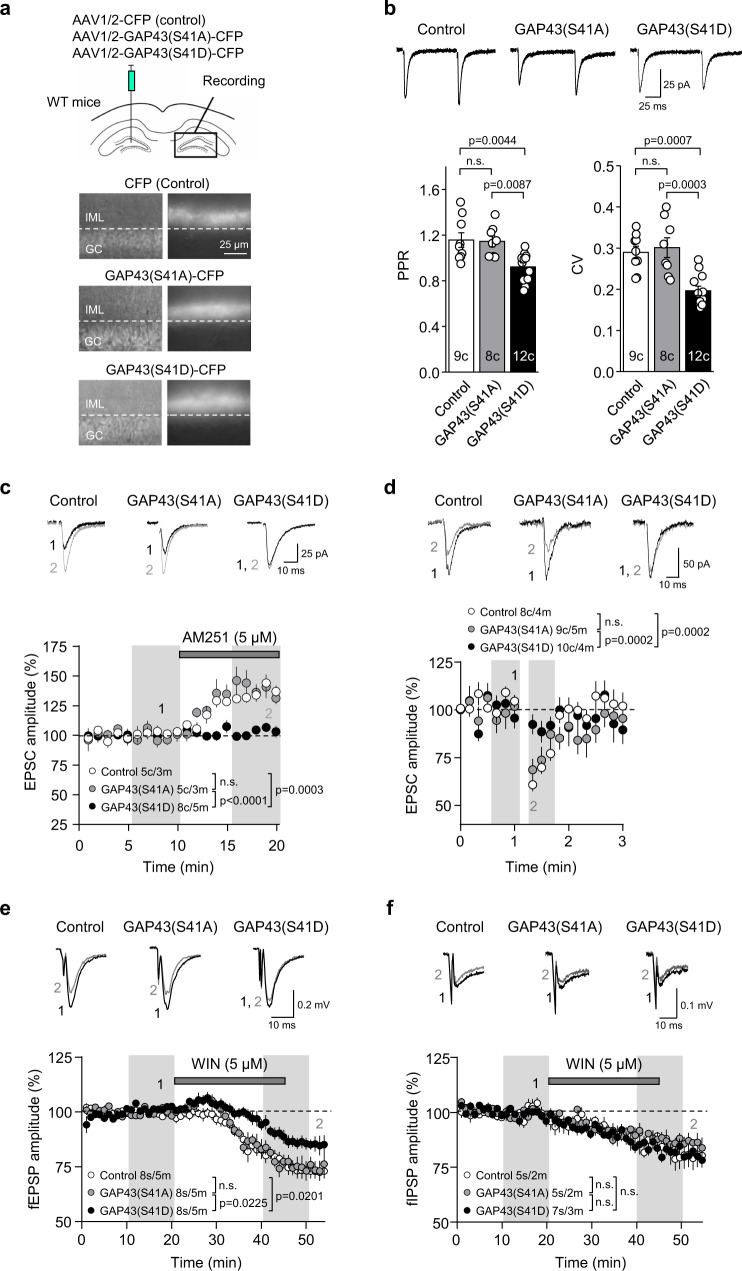
Fig. 4. Phosphorylated GAP43 inhibits CB1R function at MC-GC synapses.
a Schematic diagram illustrating the injection of AAV1/2-CBA-CFP (control), AAV1/2-CBA-GAP43(S41A)-CFP or AAV1/2-CBA-GAP43(S41D)-CFP in the hilus of 3-week-old WT mice. Electrophysiological recordings were performed in the contralateral DG. Infrared differential interference contrast (left) and fluorescence (right) images showing CFP expression in the commissural MC axon terminals in the contralateral DG. Note the presence of CFP-positive fibers in the IML and its absence in the GC layer. This CFP-expression pattern was observed in all injected animals with similar results. b Whole-cell patch-clamp recordings were performed on GCs from injected mice. Representative traces (top) and quantification bar graph (bottom) for basal PPR and CV are shown (means ± SEM; c = cells; one-way ANOVA with Tukey’s multiple comparisons test). c EPSCs recorded from injected mice upon AM251 bath application (5 μM, 10 min). Representative EPSC traces, before and after AM251 application (top), and time-course summary plot (bottom) are shown [means ± SEM, c = cells, m = mice; shaded areas indicate the time intervals at which the statistical analysis was conducted; one-way ANOVA with Tukey’s multiple comparisons test]. d DSE magnitude in injected mice. Representative traces (top) and time-course summary plot (bottom) are shown [means ± SEM; c = cells, m = mice; shaded areas indicate the time intervals at which the statistical analysis was conducted; one-way ANOVA with Tukey’s multiple comparisons test]. e fEPSPs recorded from injected mice upon WIN-55,212-2 bath application (WIN; 5 μM, 25 min). Representative fEPSP traces, before and after WIN application (top), and time-course summary plot (bottom) are shown [means ± SEM; s = slices, m = mice; shaded areas indicate the time intervals at which the statistical analysis was conducted; one-way ANOVA with Tukey’s multiple comparisons test]. f fIPSPs recorded from injected mice upon WIN bath application (5 μM, 25 min). Representative fIPSP traces, before and after WIN application (top) and time-course summary plot (bottom) are shown (means ± SEM; s = slices, m = mice; shaded areas indicate the time intervals at which the statistical analysis was conducted; n.s. by one-way ANOVA with Tukey’s multiple comparisons test). Source data are provided as a Source data file.

