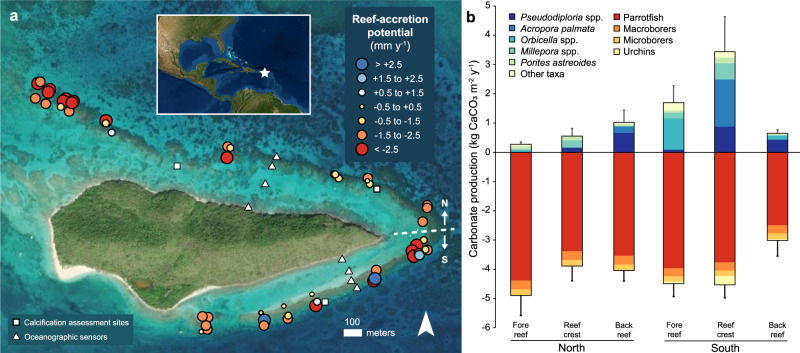
Fig. 1. Map of the study area and carbonate budgets at Buck Island Reef National Monument in 2016, highlighting the significantly higher carbonate production and coral reef-accretion potential in the southern reef crest compared with the other reef zones.
a Estimated mean reef-accretion potential (mm y−1) at 54 sites from the fore-reef, reef-crest, and back-reef habitats around the island. Locations where in situ growth of Acropora palmata and Pseudodiploria strigosa were quantified (white squares) and transects where in situ tide and wave sensors were deployed for calibration and validation of the hydrodynamic model (Fig. S4) are also shown b. Bar plot showing mean (± standard error) gross carbonate production by calcifying reef taxa (upper plot) and bioerosion by bioeroding groups (lower plot) across reef zones. Map image is the intellectual property of Esri and is used herein under license. Copyright 2020 Esri and its licensors. All rights reserved.

