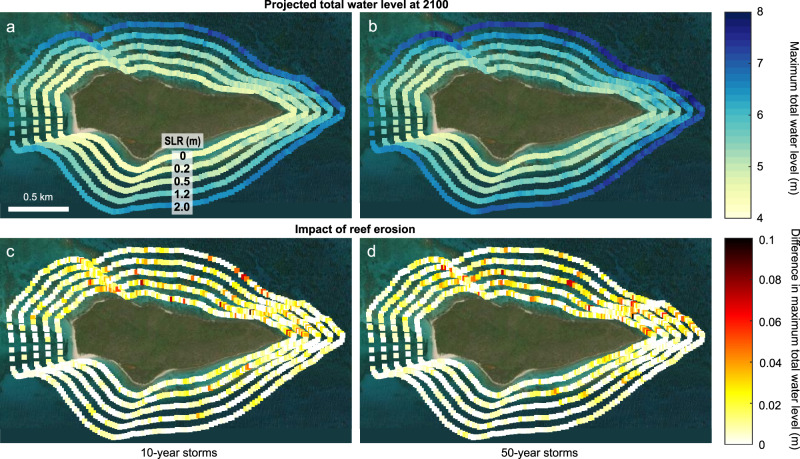
Fig. 4. Maps displaying the impact of sea-level rise and coral-reef bathymetry on alongshore variation in total water levels and thus coastal flooding potential.
In each panel, the maximum total water levels are plotted along the shoreline of Buck Island, with each ring of points representing a sea-level rise scenario, from +0.0 m (inner ring) to +2.0 m (outer ring). Left (a, c) and right (b, d) columns present results for 10-year storm (i.e., a strong tropical storm or Category-1 hurricane32) and 50-year storm scenarios (i.e., a Category-5 hurricane32), respectively. The top row (a, b) provides projections of maximum total water levels at 2100 with projected reef erosion from the carbonate-budget models under the different storm and sea-level rise scenarios. The bottom row (c, d) illustrates the impact of reef erosion by showing the difference in projections of maximum total water levels between models run with projected reef erosion (a, b) and those run with present-day bathymetries (Fig. S2). The plots indicate that although sea-level will be the most significant driver of increases in total water levels and thus flooding potential, higher total water levels under all sea-level-rise scenarios are projected for the northern sector of the island, corresponding to the areas of greatest projected reef erosion in Fig. 1. Map image is the intellectual property of Esri and is used herein under license. Copyright 2020 Esri and its licensors. All rights reserved.

