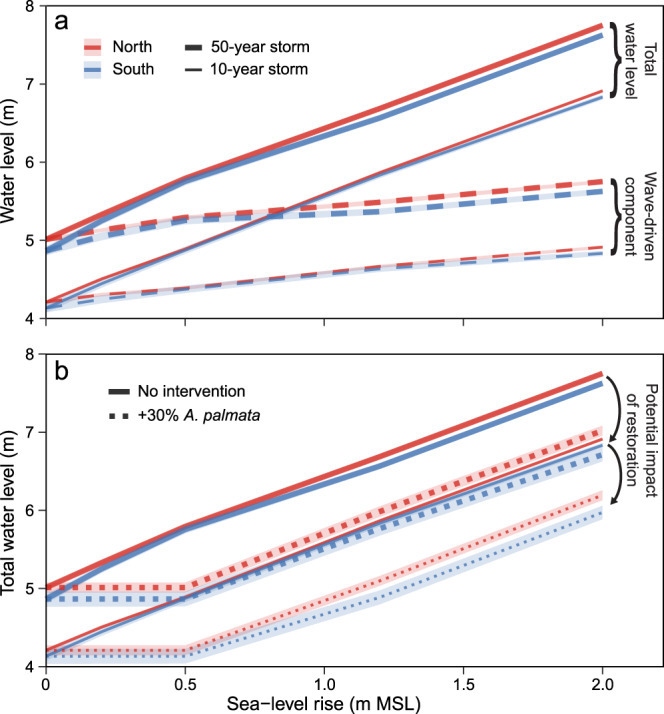
Fig. 5. Summary of the alongshore mean (± standard error [SE]) of maximum total water levels predicted to reach modeled sites (shown in Fig. 4) along the northern (n = 145) and southern (n = 71) shorelines of Buck Island by 2100 under sea-level rise (+0 to +2.0 m), storms (10- and 50-year storms), and coral restoration scenarios.

a Mean (±SE) maximum total water levels for each sea-level rise and storm scenario with reef degradation (solid lines) and the wave-driven component of total water levels (dashed lines). b Comparison of the total water levels with reef degradation in a to mean (± SE) total water levels estimated with reef elevation changes (Fig. 3) projected under a 30% increase in A. palmata cover through restoration (dotted lines), demonstrating how successful restoration could help mitigate some of the impacts of future sea-level rise at Buck Island (i.e., by reducing total water levels by up to 0.81 m). Note that because this figure presents spatially averaged trends, the alongshore variability apparent in Fig. 4, including areas of non-linear total-water-level changes, is less clear. Uncertainties (SEs) for the restoration scenario are the root-sum-squares of the uncertainties in total water levels and of projected reef-elevation change with restoration.
