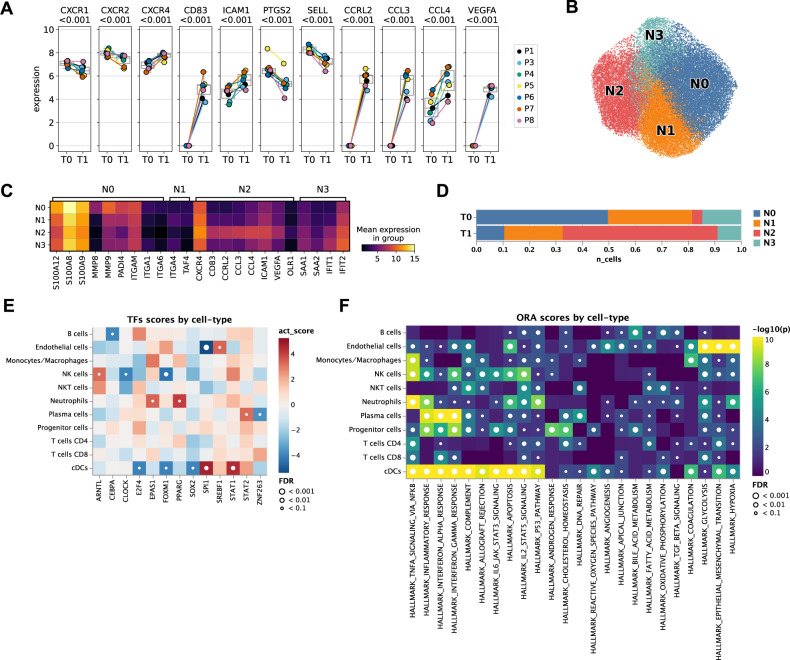
Fig. 5. NMP shifts neutrophils towards an aged/chronically activated/exhausted phenotype.
A Expression of selected marker genes in neutrophils pre (T0) and at the end of (T1) NMP in individual patients (n = 7). The central line denotes the median. Boxes represent the interquartile range (IQR) of the data, whiskers extend to the most extreme data points within 1.5 times the IQR. Two-sided DESeq2 Wald-test on pseudo-bulk, p-values are adjusted to false-discovery rate (FDR) using independent hypothesis weighting (IHW). B UMAP of neutrophils colored by subclusters (N0, N1, N2, N3). C Expression of selected marker genes in neutrophil subclusters. D Relative composition of neutrophil subclusters pre (T0) and at the end of (T1) NMP. E Differential transcription factor activity (TF) activity per cell-type in T0 vs. T1 computed using DoRothEA. Red indicates upregulation of a TF-regulon in T1 compared to T0. p-values were determined using a two-sided t-test and adjusted for false-discovery rate (FDR). The t-statistics were computed using a multivariate linear model as implemented in decoupler-py. F Gene set over-representation analysis (ORA) of selected “Hallmark” gene sets per cell type in T0 vs. T1. A small p-value indicates that among genes in the gene set, more genes are differentially expressed than expected by chance (one-tailed Fisher’s exact test).

