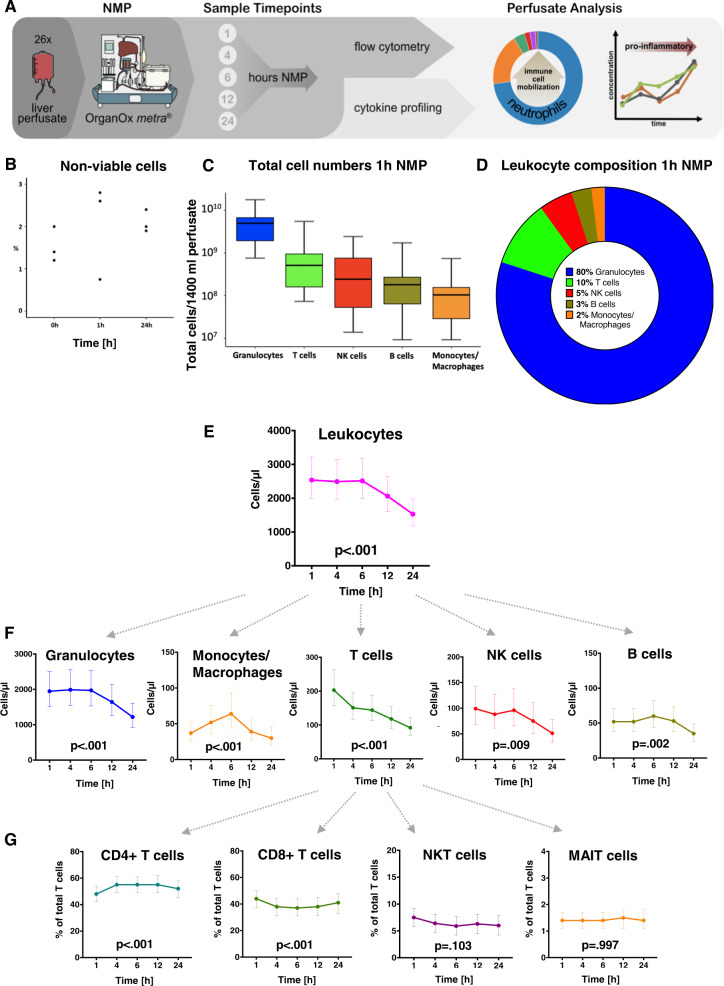
Fig. 7. Total release of passenger leukocytes into the perfusate (n = 26) at various time points during NMP.
A NMP perfusate analysis workflow and applied methods. B Cell viability testing prior to flow cytometry (n = 3 pre, at 1 h NMP and at the end of NMP) showed only a very small percentage of non-viable cells in the perfusate. C Absolute CD45+ leukocyte amounts for main immune cell subtypes in total circulating perfusate (mean ± SEM) and D composition at 1 h NMP. E, F Dynamic change of total CD45+ leukocytes and main subtypes during NMP. G Dynamic change of CD3+ T cell subtypes (proportions) over perfusion time. Graphs show the marginal effects. The values are estimated using linear regression analysis. The p-values refer to the change over time. The least-squares means computed using a linear model are shown together with the 95% CI. N = 26 biologically independent samples. Source data are provided as a Source Data file. NK cells natural killer cells, NKT cells natural killer T cells, MAIT cells mucosa-associated invariant T cells.

