figs3.
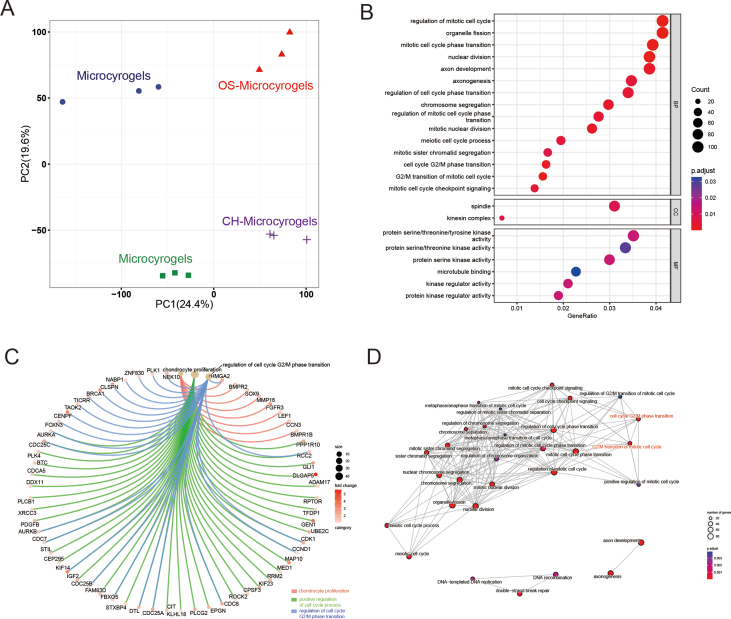
mRNA-seq and differentially expressed gene (DEG) analyses of MSCs of microgels and CH microgels after 7 days of chondrogenic induction. (A) PCA of mRNA-seq. (B) The bubble chart represents the significantly enriched pathways identified in the GO analysis. (C) Circular plot of DEGs mainly associated with the biological process of chondrocyte proliferation, positive regulation of cell cycle process, and regulation of cell cycle G2/M phase transition. (D) The PPI network of DEGs.

