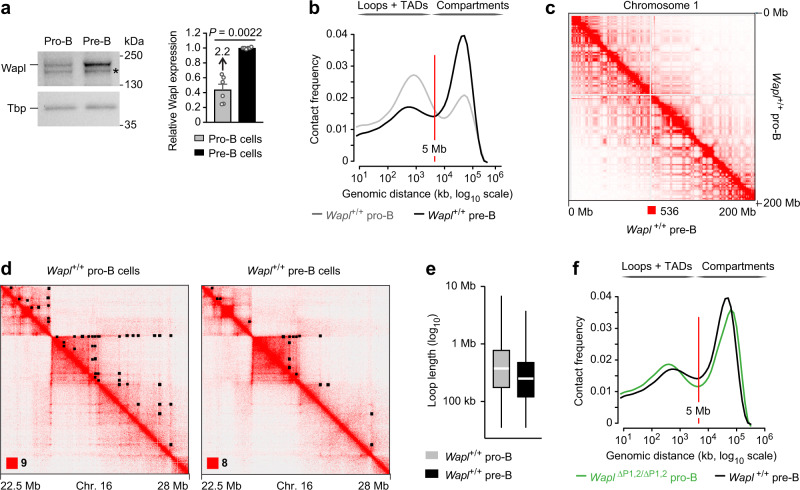
Fig. 3. Wild-type pro-B and pre-B cells strongly differ in their chromosomal architecture.
a Wapl protein expression in ex vivo sorted Rag2–/– pro-B (gray) and wild-type pre-B (black) cells from the bone marrow, as determined by immunoblot analysis of whole-cell extracts with antibodies detecting Wapl or Tbp (loading control). Marker proteins of the indicated size (in kilodaltons, kDa) are shown to the right. A non-specific band is indicated by an asterisk. One of 5 independent experiments is shown, and the quantification of all immunoblot experiments is indicated to the right. Statistical data are shown as mean values with SEM and were analyzed with the Student’s t-test (unpaired and two-tailed). b Comparison of the frequency distribution of intrachromosomal contacts between pro-B and pre-B cells of Wapl+/+ mice. The frequency distribution of intrachromosomal contacts was determined as a function of the genomic distance using logarithmically increased genomic distance bins, based on the Hi-C data of Wapl+/+ pre-B cells (black, this study) and published Hi-C data of short-term cultured Wapl+/+ pro-B cells (gray)20. c Hi-C contact matrices of chromosome 1, determined for Wapl+/+ pro-B and Wapl+/+ pre-B cells, were plotted at a 500-kb bin resolution with Juicebox74. The maximum pixel intensity is indicated below (red square). d Hi-C contact matrices of a zoomed-in region on chromosome 16 (mm9; 22,500,000–28,000,000), shown for Wapl+/+ pro-B and pre-B cells. Black dots indicate loop anchors identified with Juicebox74. e Distribution of the loop length (in kb) in Wapl+/+ pro-B (gray) and pre-B (black) cells. White lines indicate the median and boxes represent the middle 50% of the data. Whiskers denote all values of the 1.5× interquartile range. The median loop length is 375 kb in Wapl+/+ pro-B cells and 250 kb in Wapl+/+ pre-B cells. f Comparison of the frequency distribution of intrachromosomal contacts between Wapl+/+ pre-B cells (black) and Wapl∆P1,2/∆P1,2 pro-B cells (green)20, as described in (b). Source data are provided in the Source Data file.

