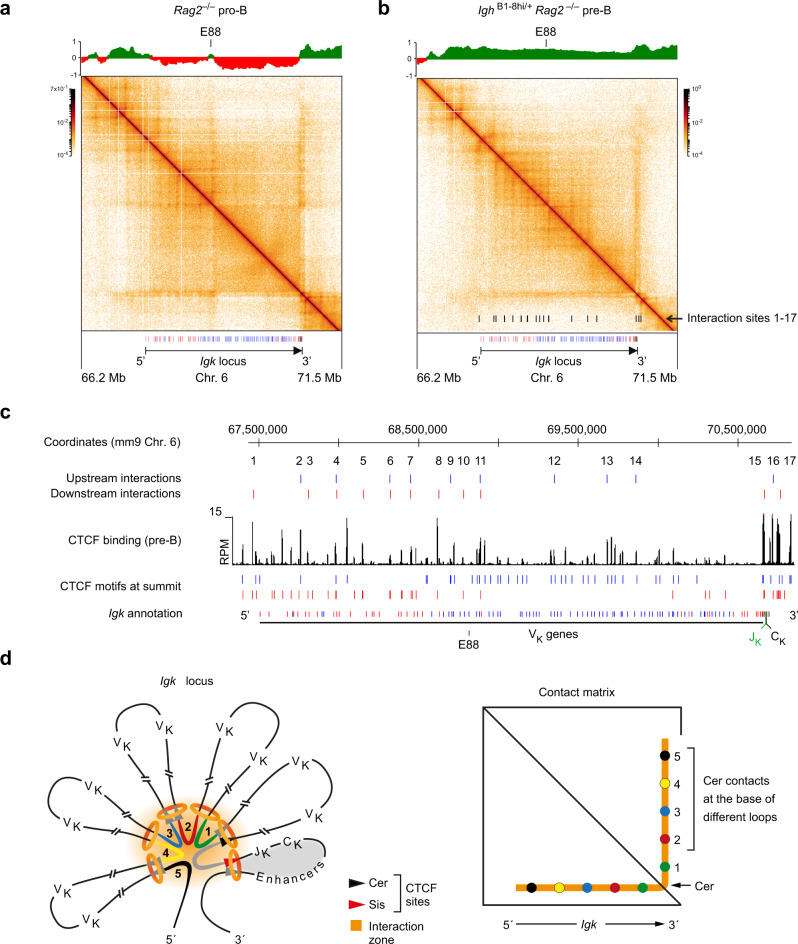
Fig. 5. High-resolution mapping of loop interactions at the Igk locus in Rag2-deficient pro-B and pre-B cells.
a, b Contact matrices of the Igk region (on chromosome 6) in ex vivo sorted Rag2–/– pro-B cells (a) and IghB1-8hi/+ Rag2–/– pre-B cells (b). The interaction data were determined by Micro-C analysis45,46 and are displayed at a 10-kb bin resolution with the HiGlass visualization tool81. Each dot on the contact matrix represents the contact intensity between a pair of nucleosomes according to the density scale shown. White lines denote regions that could not be mapped due to too low contact density. The annotation and orientation of the Igk locus are shown below. The PC1 (eigenvector) values, which define the compartments A (green) and B (red), are shown above the contact matrices together with the location of the E88 enhancer42. The locations of the contact sites that generate the different stripes at the Igk locus are indicated as black bars at the bottom of the contact matrix of IghB1-8hi/+ Rag2–/– pre-B cells (b). c Location of the mapped loop anchors at the Igk locus in IghB1-8hi/+ Rag2–/– pre-B cells. The anchor sites of loops facing upstream (blue) or downstream (red) in the Igk locus of pre-B cells were determined with the Cross-score program, as described in detail in Supplementary Fig. 7, and are shown above the CTCF ChIP-seq track and the annotation of the forward (red)- and reverse (blue)-oriented CBEs. d Schematic diagram explaining the looping organization of the Igk locus. Due to the presence of forward and reverse CBEs along the VK gene cluster, multiple different loops are formed, which leads to the collision of cohesin rings (orange) in response to ongoing loop extrusion. As a consequence, a transient interaction zone (orange) is formed that juxtaposes DNA sequences (1–5) at the base of these loops next to DNA sequences (gray) of the Cer region, which facilitates their crosslinking and defines specific interactions along the stripe emanating from the Cer region in the Micro-C data. Due to the high Wapl expression in pre-B cells, loops constantly turn over so that new loops present different DNA sequences in the interaction zone (see Supplementary Movie 1), which results in a contiguous stripe consisting of all possible interactions along the VK gene cluster. The orientation of CBEs in the VK gene region is indicated by gray arrowheads, while the CBEs at Cer and Sis are shown in black and red, respectively. The relatively stable “regulatory” loop containing the JK, CK, and Igk enhancer elements is indicated by gray shading.

