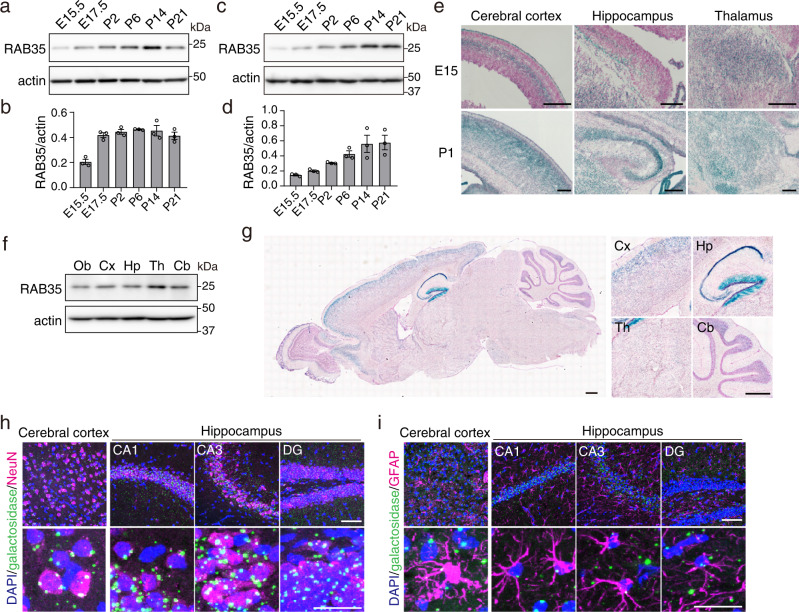
Fig. 1. Expression profile of RAB35 in the mouse brain.
a RAB35 protein levels in the whole mouse brain during the embryonic (E15.5 and E17.5) and postnatal (P2, P6, P14, and P21) periods. b Quantification of RAB35 protein levels in the whole mouse brain. Band intensities of RAB35 were normalized against those of actin (n = 3 per the indicated stage). c RAB35 protein levels in the hippocampus during the embryonic (E15.5 and E17.5) and postnatal (P2, P6, P14, and P21) periods. d Quantification of RAB35 protein levels in the mouse hippocampus (n = 3 per stage). e X-gal staining of sagittal sections from E15 and P1 Rab35geo/+ mouse brains. Scale bars, 200 μm. f RAB35 protein levels in 3-month-old mouse brain subregions. Ob olfactory bulb, Cx cerebral cortex, Hp hippocampus, Th thalamus, Cb cerebellum. g X-gal staining of a sagittal section of a 3-month-old Rab35geo/+ mouse brain. Scale bars, 500 μm. h, i Representative maximum intensity projection images of 4-month-old Rab35geo/+ mouse brain stained for β-galactosidase (green), NeuN or GFAP (magenta), and DAPI (blue). Scale bar; upper panel, 50 μm; lower panel, 20 μm. Data represent mean ± SEM.

