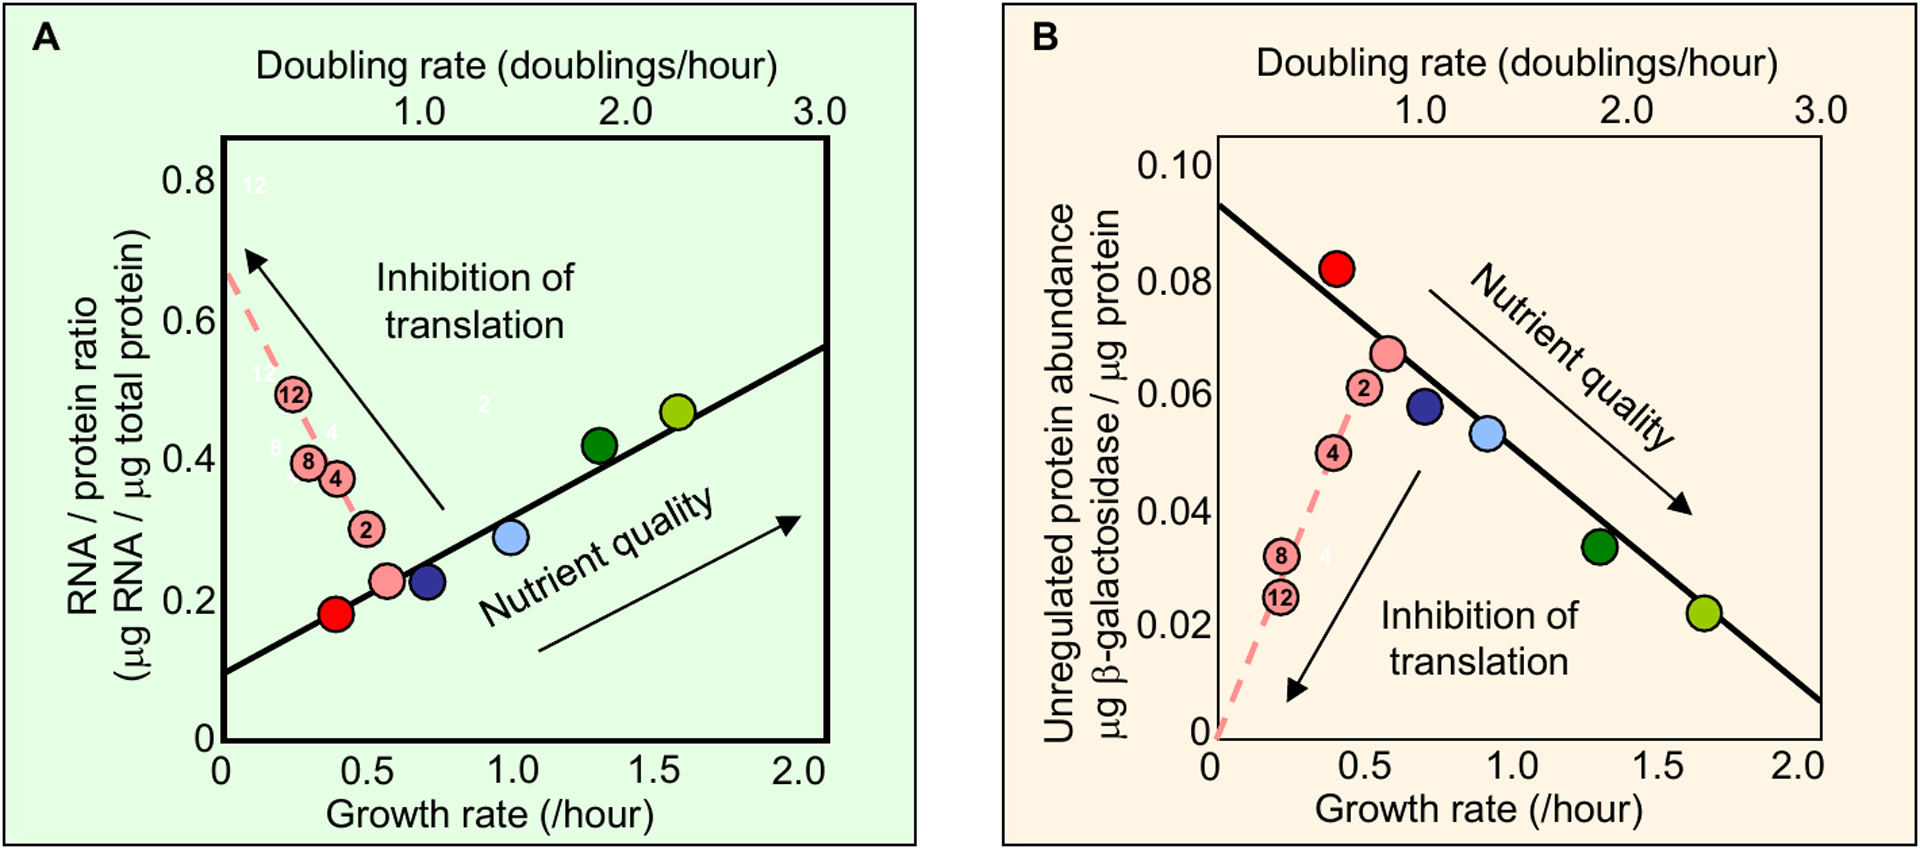
Figure 2: Growth-dependence of ribosomal and non-ribosomal proteins.

Escherichia coli cells are cultured to grow exponentially at different growth rates by using different nutrients (colored symbols along the solid black lines) or by applying various sub-lethal concentrations of translation-inhibiting antibiotics for a given nutrient (dashed lines, μM chloramphenicol shown inside the circles). Panel a shows that the RNA:total protein ratio, which is proportional to the ribosome concentration, exhibits approximate linear dependence on the growth rate: the dependence is positive when changing nutrient quality (solid line) and negative when changing antibiotic concentration (dashed line). Panel b shows that the concentration of an unregulated protein (pTetO1 driving lacZ (β-galactosidase) expression, using the activity:total protein ratio as a proxy) also exhibits approximate linear dependence on the growth rate, but in the opposite directions from that of the RNA:protein ratio shown in a. Comparing both panels, the strong anti-correlation between the concentration of ribosomes and the concentration of a constitutive protein suggests a linear constraint (like a see-saw) operating between them. The data are taken from Figs 2A and 2C of Scott et al.22.
