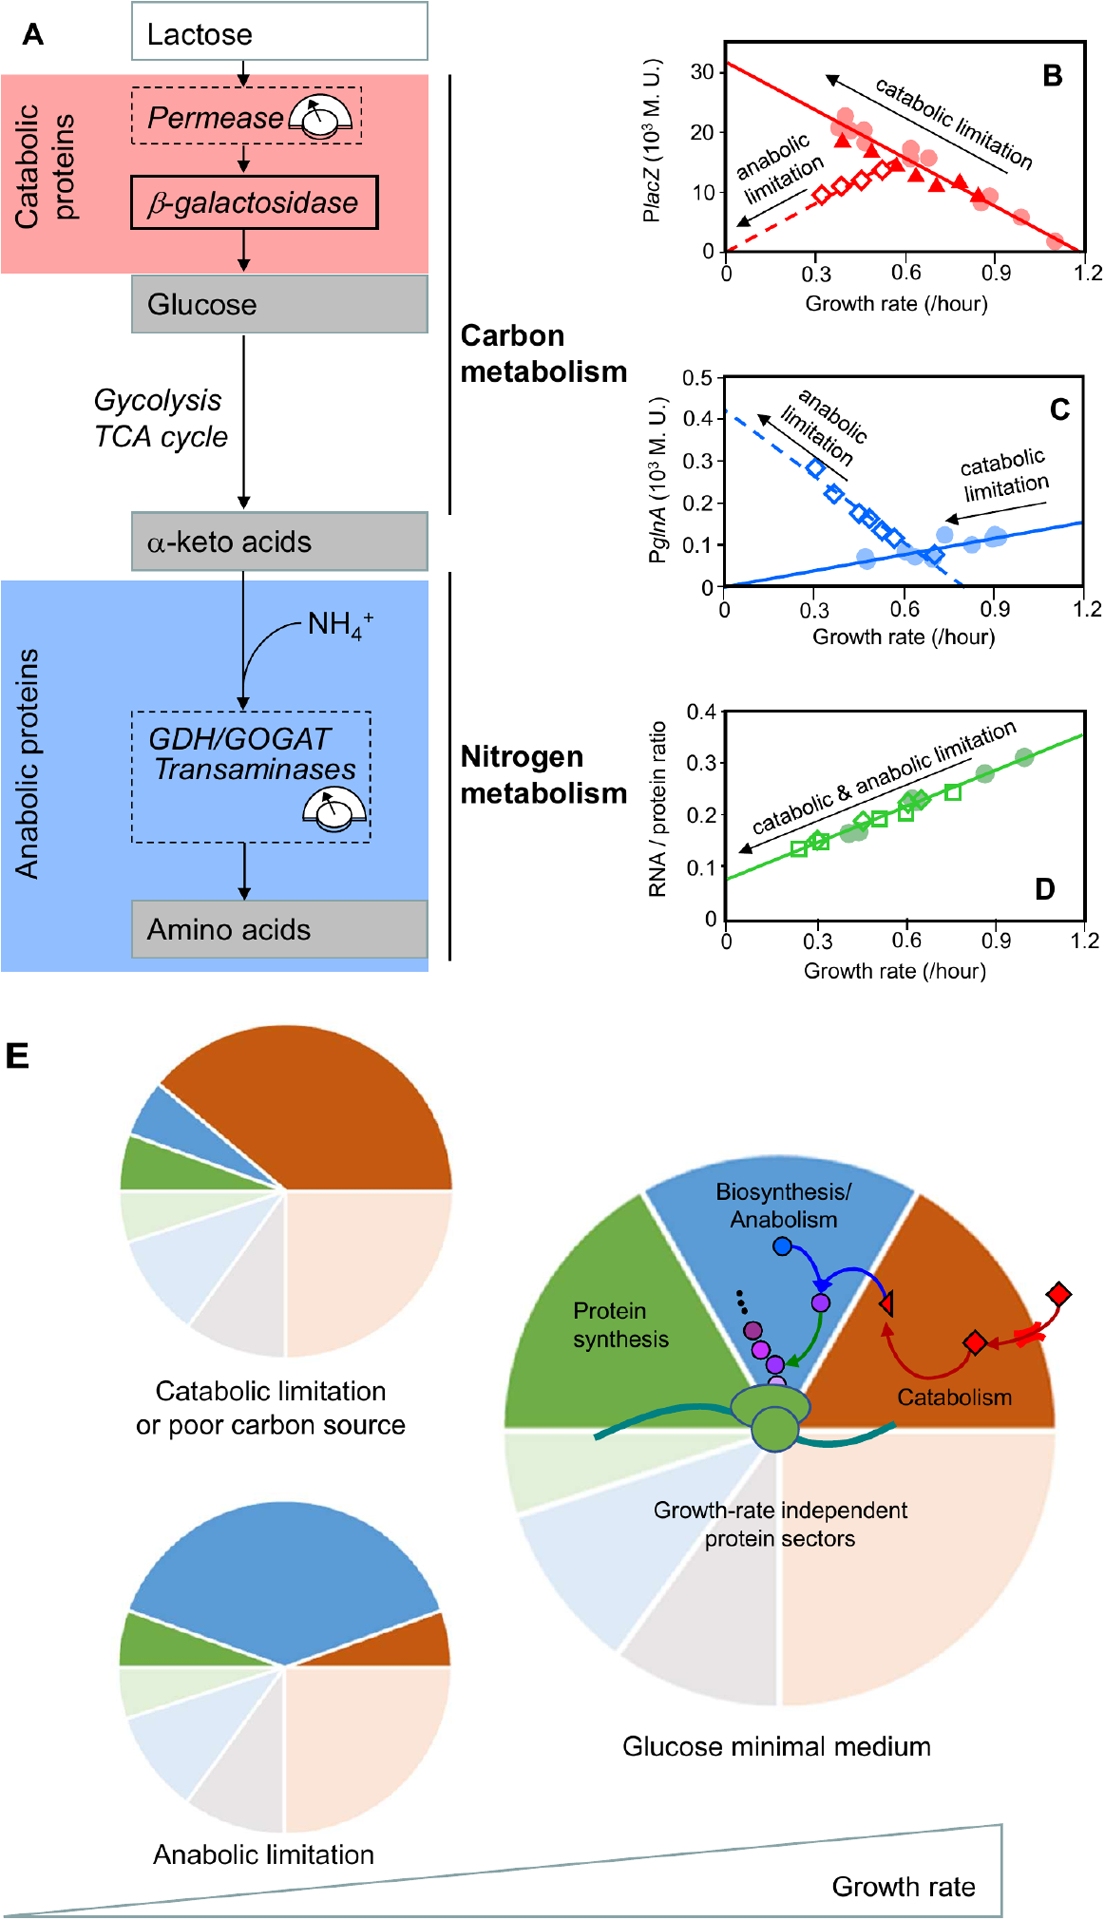
Figure 3: Modulation of carbon and nitrogen flux reveals protein-synthesis constraints on catabolic and anabolic proteins.

a. In a minimal growth medium without externally supplied amino acids, the bacterium must synthesize amino acids via amination of carbon precursors (ketoacids)54. These precursors are supplied through the carbon-catabolic enzymes, glycolysis, the tricarboxylic acid (TCA) cycle, and various biosynthesis pathways. To minimize substrate-specific effects, carbon influx was modulated by titrating the expression of the uptake system (lactose permease for growth on lactose24) or by changing the carbon source in minimal medium. The nitrogen flux was modulated by titrating glutamate dehydrogenase (GDH) in a glutamine oxoglutarate aminotransferase (GOGAT)-deleted background24, or by titrating GOGAT in a GDH-deleted background27. The flux-control points are denoted by dashed boxes. b–d. Proxies for the carbon-catabolic and anabolic protein concentrations are β-galactosidase activity (lacZ; panel b) and glutamine synthetase activity (glnA; panel c), respectively. These proxies quantitatively capture the behavior of many other catabolic and anabolic proteins, as validated by later proteomic work15,27. Carbon-catabolic and anabolic enzyme concentrations exhibit obvious anti-correlation and near-linear growth dependence under various growth perturbations, whereas the ribosomal proteins exhibit a positive linear correlation with growth rate irrespective of the metabolic limitation that is used (RNA:protein ratio; panel d. The red line in panel b is sometimes called the ‘C-line’24, and can be taken as a defining feature of carbon catabolite repression (Box 1). Carbon flux was modulated by a change in carbon source (filled circles), or by titrating lactose permease (filled triangles); nitrogen flux was modulated by titrating GDH in a GOGAT-deleted background (open diamonds). e. The correlations among the abundances of catabolic, anabolic and ribosomal proteins can be understood quantitatively if abundance is measured in units of protein mass fraction. The constancy of protein density and the allocation constraint on the protein synthetic machinery are both captured by a coarse-grained partitioning of the proteome. For simplicity, only four sectors are shown: growth-rate dependent ribosomal (and ribosome-affiliated) (green), biosynthetic/anabolic (blue) and catabolic (red) sectors, along with their associated growth-rate independent basal expression (pale sectors), and a growth-rate independent sector (gray)27. The near-linear response of the growth-dependent sectors is rationalized by invoking a simple flux balance: external nutrients are converted to carbon precursors by the catabolic proteins (red arrows) and converted into amino acid precursors (purple circles) by the biosynthetic proteins (blue arrow), at a rate matched with amino acid consumption by protein synthesis (green arrow). Catabolic limitation leads to increased expression of catabolic proteins (top left), whereas anabolic limitation leads to increased expression of anabolic proteins (bottom left). Rightmost figures from Figs. 1A, 1C, 1D of You et al.24.
