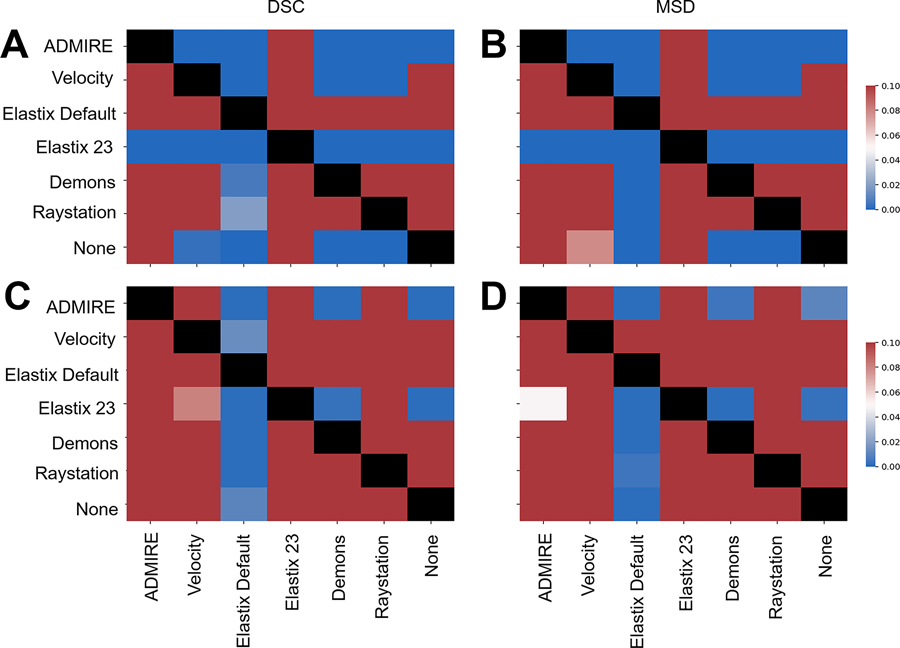
Figure 4.
Heatmap of Bonferroni corrected p-values for one-way Wilcoxon-signed rank tests for pair-wise comparisons between various registration methods indicating significant improvement of method in row vs. method in column. Top plots correspond to all pooled organ at risk structures using Dice similarity coefficient (DSC) (A) and mean surface distance (MSD) (B). Bottom plots correspond to tumor using DSC (C) and MSD (D). Blue colors correspond to significant p-values (p<0.05) while red colors correspond to non-significant values (p>0.05). Comparisons between the same method (diagonal entries) are blacked out.

