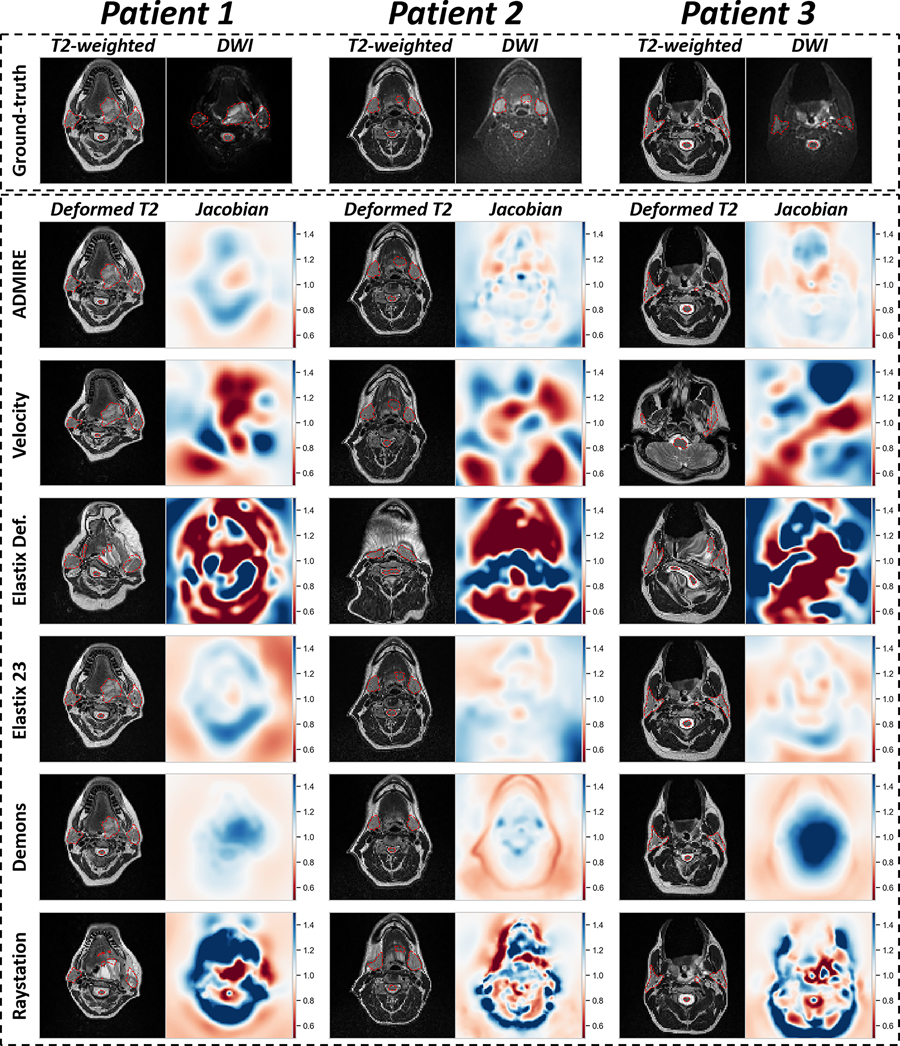
Figure 5.
Visualization of deformable image registration method outputs for 3 example patients. The top row shows original T2-weighted image and diffusion weighted image (DWI) with ground-truth segmentations overlaid (red dotted outline). The deformed T2-weighted image with overlaid propagated segmentation (red dotted outline) and corresponding Jacobian determinant is shown for each image registration method. Jacobian determinant plots are all shown on the same color bar scale from 0 to 1.5. Jacobian determinants greater than 1 (blue colors) indicate volume expansion, between 0 and 1 (red colors) indicate volume reduction, and equal to 1 (white color) indicates no change.

