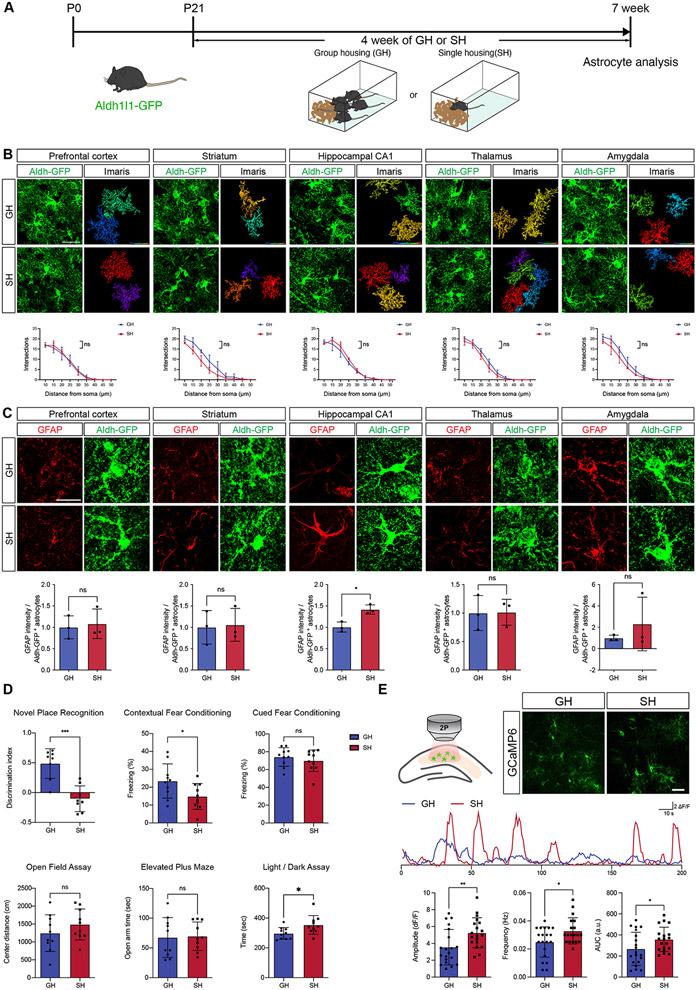
Figure 1. Social deprivation alters core properties of hippocampal astrocytes.
(A) Schematic of Group Housing (SH) and Single Housing (SH) Paradigms.
(B) Imaging of Aldh1l1-GFP astrocytes and quantification of morphological complexity using Scholl analysis from prefrontal cortex, striatum, CA1, thalamus, and amygdala (n = 3 pairs of animals, at least 10 cells from each animal). Two-way ANOVA.
(C) Immunostaining for GFAP expression in prefrontal cortex, striatum, CA1, thalamus, and amygdala of Aldh1l1-GFP mice from GH and SH cohorts. Welch’s t-test. (n = 3 pairs of animals, 3 sections per animal)
(D) Behavioral results from GH and SH cohorts (n = 8-10 animals)
(E) Representative image showing expression of GCaMP6s in astrocytes and representative spontaneous Ca2+ of two-photon, slice imaging from the hippocampus of GH and SH mice quantification is derived from n = 19-20 cells from 3 pairs of animals. Welch’s t-test.
*p < 0.05; **p < 0.01; ***p < 0.001; ****p < 0.0001.

