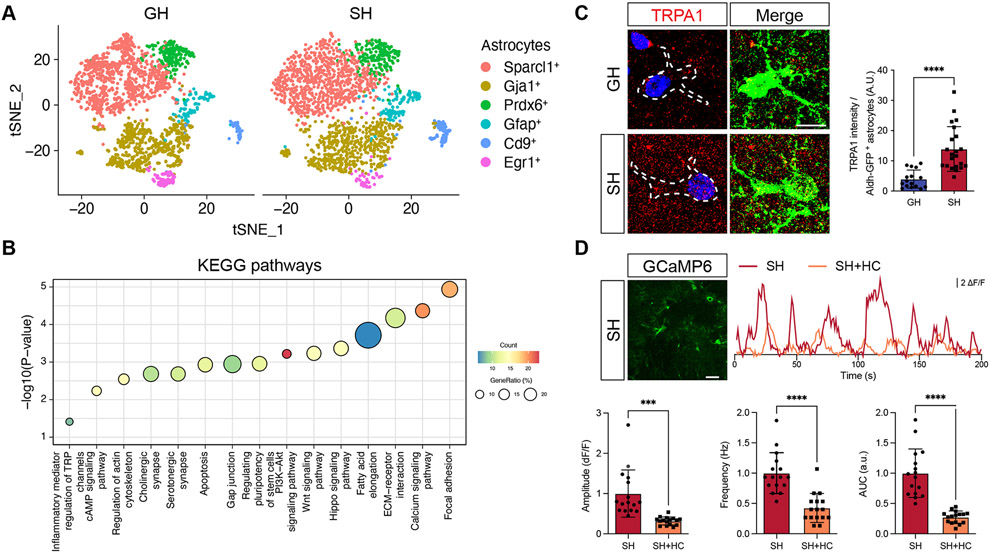
Figure 2. TRPA1 expression is increased in astrocytes after social deprivation.
(A) Serut analysis of single cell RNA-Seq (scRNA-Seq) of hippocampal astrocytes from a pair of GH and SH.
(B) KEGG pathway analysis of differentially expressed gene (DEGs) between GH and SH cohorts (cutoff for DEGs, adjusted p < 10−15, average log2 foldchange > 2).
(C) Immunostaining for TRPA1 expression in Aldh1l1-GFP mice from GH and SH cohorts (n = 16-22 cells from 3 pairs of animals). Welch’s t-test.
(D) Representative image showing expression of GCaMP6s in astrocytes and representative spontaneous Ca2+ of two-photon, slice imaging from the hippocampus of SH mice, treated with vehicle or HC030031 (HC); quantification is derived from n = 16 cells from 3 pairs of animals. Welch’s t-test.
*p < 0.05; **p < 0.01; ***p < 0.001; ****p < 0.0001.

