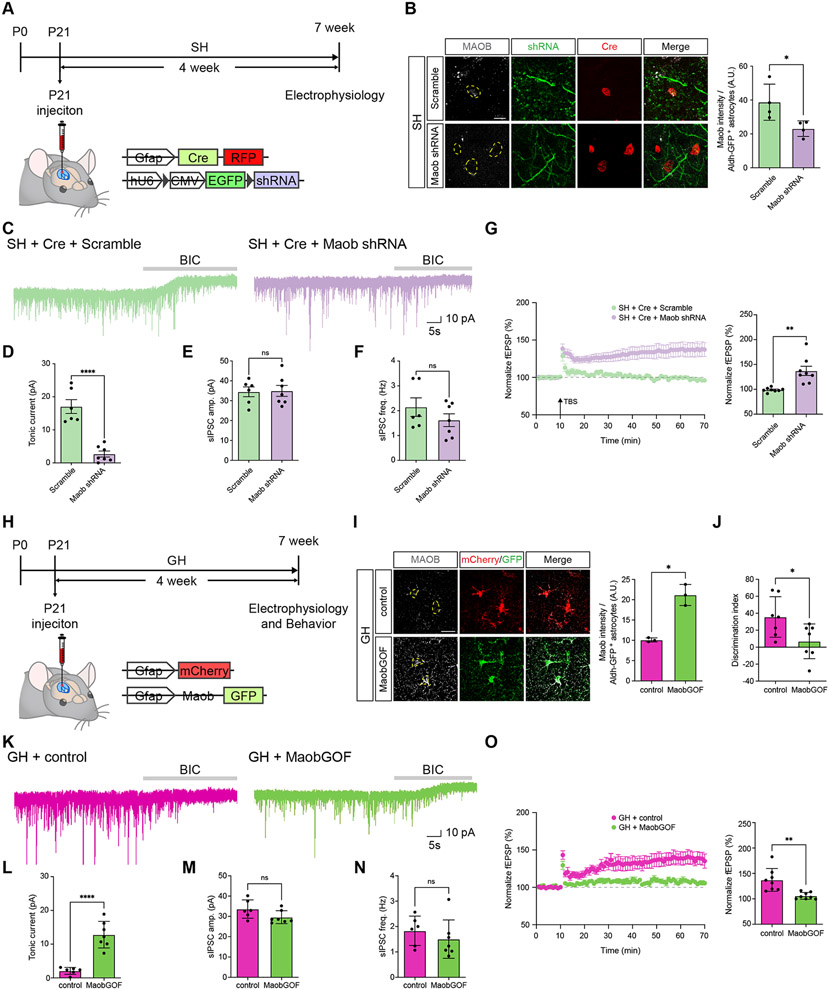
Figure 6. Maob knockdown rescues hippocampal circuit function after social deprivation.
(A) Schematic of AAV-Cre and lentiviral-based shRNA approach for knocking down Maob in hippocampal astrocytes and time line of experimental paradigm.
(B) Immunostaining for Maob and Cre-RFP in hippocampal astrocytes from GH or SH after Maob knockdown paradigms. (n = 4 pairs of animals) Welch’s t-test
(C) Representative traces measuring tonic GABA currents in CA1 pyramidal neurons in GH and SH cohorts Cre plus scramble or Cre plus Maob shRNA.
(D-F) Quantification of tonic GABA current (D), sIPSC amplitude (E), and sIPSC frequency (F) from the same cohorts and experimental conditions. Welch’s t-test.
(G) Recording of Long-Term Potentiation (LTP) from the hippocampus in SH cohorts treated under control (Scramble) or Maob knockdown (Maob shRNA) genetic conditions. Welch’s t-test.
(H) Schematic for Maob overexpression in hippocampal astrocytes and the timeline of the experimental paradigm.
(I) Immunostaining for Maob in hippocampal astrocytes after Maob overexpression from GH paradigm. (n = 3 pairs of animals) Welch’s t-test.
(J) NPR behavioral studies on GH cohorts from control or Maob overexpression groups (n = 7 animals in each group). Welch’s t-test.
(K) Representative traces measuring tonic GABA currents in CA1 pyramidal neurons in control or Maob overexpression groups in the GH paradigm.
(L-N) Quantification of tonic GABA current (L), sIPSC amplitude (M), and sIPSC frequency (N) from the same cohorts and experimental conditions. (n= 3 animals per group). Welch’s t-test.
(O) Recording of Long-Term Potentiation (LTP) from the hippocampus in GH cohorts treated under control or Maob overexpression. Welch’s t-test.
*p < 0.05; **p < 0.01; ***p < 0.001; ****p < 0.0001.

